India's Third Giant Leap
This Could be One of the Biggest Opportunities for Investors
- Home
- Outlook Arena
- Oversold Stocks
Oversold Stocks
Even in a bull market, there are certain stocks which go out of favour and underperform their peers.
Investors like to look for stocks that have attracted too much attention in the market. These stocks have been sold to the extent that sellers are increasingly scarce. The implication is that these stocks are likely to rebound.
In technical analysis, this condition is called 'oversold'.
How does one know if the stock is oversold or overbought? We can find out with the help of RSI (Relative Strength Index).
Created by Welles Wilder, the RSI tells us if an index or a stock is overbought or oversold.
This technical indicator has a reading from 0 to 100. If the RSI is 70 or higher, the security is overbought. If the RSI comes near 30 or below, it's oversold.
But remember, like most investing tools, the RSI has its limitations. So you should combine RSI with other indicators to get a better picture. This can help cut down your margin of error.
![]() The 12 Best Oversold Stocks to Add to Your Watchlist
The 12 Best Oversold Stocks to Add to Your Watchlist
Feb 27, 2023
Is it finally time to get in these oversold stocks in India?
![]() Nifty 50 is in an Oversold Zone, but...
Nifty 50 is in an Oversold Zone, but...
Sep 27, 2022
Here's what I think the Nifty will do today.
![]() Options Writers Should Grab the Opportunity in the Nifty this Week
Options Writers Should Grab the Opportunity in the Nifty this Week
Aug 23, 2022
The Equitymaster proprietary TruStop (TM) system indicates the Nifty is likely to consolidate.
![]() A Proven Technical Indicator Signals a Possible Buy for these 5 Stocks
A Proven Technical Indicator Signals a Possible Buy for these 5 Stocks
Feb 21, 2022
Since it's a long term average, the 200-DMA is considered as a major support level for an index or a stock.
5 Stocks that Investors Can't Get Enough of
Oct 2, 2021
These stocks are extremely overbought at the moment. Should you sell?
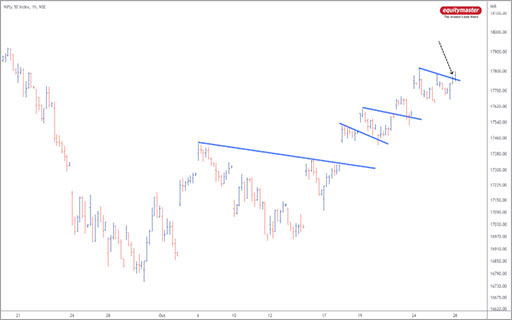
![]() Nifty 50's First Day First Show
Nifty 50's First Day First Show
Oct 28, 2022
The bearish candlestick pattern high of 17,811 will be the level for the resumption of the bullish momentum.
![]() An Option Strategy Nifty Traders Shouldn't Miss Out On
An Option Strategy Nifty Traders Shouldn't Miss Out On
Sep 15, 2022
Options traders can look for strangle short strategy for next week or monthly expiry.
![]() Why the Nifty can Still go the Distance
Why the Nifty can Still go the Distance
Aug 3, 2022
The Nifty charts are still bullish.
The Most Oversold Stocks in India. Is it Finally Time to Get in?
Jan 7, 2022
With the help of relative strength index (RSI), we take a look at top stocks that are oversold at current levels.
![]() End of the Nifty Bull Run?
End of the Nifty Bull Run?
Jul 30, 2021
Is the Nifty forming a short-term top?


