India's Third Giant Leap
This Could be One of the Biggest Opportunities for Investors
- Home
- Outlook Arena
- Best Steel Stocks in India
Best Steel Stocks in India
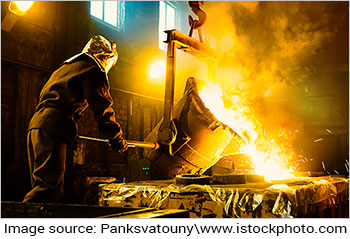
The steel sector has been the core driver of the Indian economy for several years now.
As steel is used as a raw material and intermediate product in almost every sector it's no surprise that the sector forms the backbone of the economy. Automobiles, buildings, bridges, heavy machinery - you name it, and steel is required for it.
India is the world's second largest steel producer and the third largest steel consumer in the world.
In just a decade, how quickly things have changed. From being a net importer in 2012, India is now a net exporter of steel.
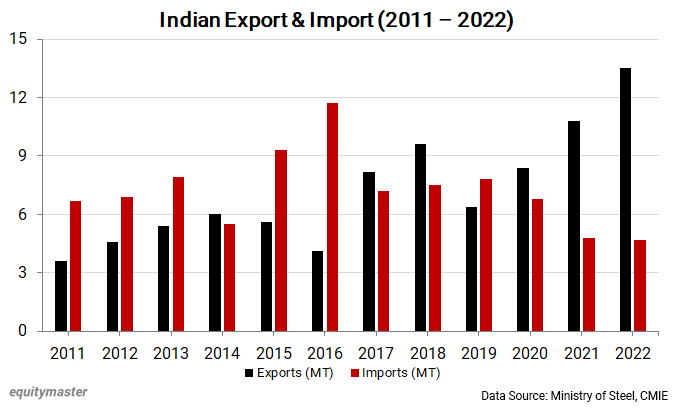
This has been possible because of the government's timely policies. The growth has also been aided by lower domestic demand and the foreign trade agreements that India has with countries like Japan and South Korea.
As India aims to become a manufacturing hub through campaigns such as 'Make in India' and 'Atmanirbhar Bharat', the steel sector is one that stands to benefit tremendously.
An Ernst and Young report titled 'Steering India into a US$5 trillion economy with Steel' says that the sector will play an integral role in steering India towards a US$5 tn economy by 2025.
Porter's Five Forces Analysis of the Steel Sector in India
Porter's Five Forces is a model that identifies and analyzes five competitive forces that shape every industry.
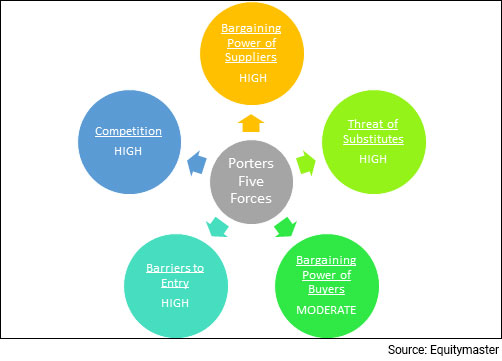
These are barriers to entry, bargaining power of suppliers, bargaining power of customers, threat of substitutes and competition within the industry.
A change in any of the forces normally requires a company to re-assess the marketplace.
Let us have a look at how these five forces shape the steel sector -
#1 Barriers to Entry
The most attractive segment is one in which barriers to entry are high as they restrict the threat of new entrants.
Conversely if the barriers are low, the risk of new companies venturing into a given market is high.
In the steel sector, barriers to entry are high, due to capital costs, technology requirements, economies of scale, and government regulations
#2 Bargaining Power of Suppliers
The bargaining power of customers is the ability of suppliers to put the firm under pressure. Suppliers may refuse to work with the firm or charge excessively high prices for unique resources.
This is high in the steel industry, mainly due to the fact that supply of the main raw material, iron ore is controlled by the government.
Strict rules, regulations and costs increase the power of suppliers.
#3 Bargaining Power of Customers
The bargaining power of customers is the ability of customers to put the firm under pressure. It is high if buyers have many alternatives and low if they have few choices.
In the steel sector, the bargaining power of customers is moderate, as there are few suppliers of steel as compared to buyers.
#4 Competition
For most industries, having an understanding of the competition is vital to successfully marketing a product.
The competition in the steel industry is high, due to the presence of a large number of players in the unorganized sector, imports from China, Russia and FTA Countries such as Japan and South Korea.
#5 Threat of Substitutes
A substitute product uses a different technology to try to solve the same economic need.
This is high for the steel sector, due to increased use of aluminium. Consumers have also switched to plastic because of the weight.
Porters Five Forces Analysis of the Steel Sector in India
How and When to Invest in Steel Stocks
Steel stocks are usually risker as their fortunes are prone to economic booms and busts. For this reason, they are called cyclical stocks.
Cyclical stocks do well when the economy is doing well and vice versa.
However, before selecting a stock, one must check whether the industry is due for revival or not.
Let us analyze how you could have timed your entry and exit in steel stocks during the 2019-2022 period.
Steel Sector Over the Past 3 Years
| Steel Sector | Demand | Debt | Steel Prices | Valuation | Action to be taken |
|---|---|---|---|---|---|
| 2019 | Moderate | High | Moderate | Moderate | Equal Weight |
| 1H2020 | Weak | High | Low | Very Low | Time to buy |
| 2H2020 | Moderate | Moderate | High | Moderate | Time to increase weightage |
| 2021 | Strong | Low | High | High | Equal Weight |
| 2022 | Moderate | Low | High | Very High | Time to cut exposure |
2019 - The steel sector was in a steady scenario with moderate demand and steady prices. These were high debt companies.
1H2020 - The pandemic led to a crash in commodity prices. Post this, demand vanished, and stock prices halved. This was the time to buy.
2H2020 - The global economy started to recover due to free money doled out by central banks. Consequently, steel demand and prices started firming up. Container shortages and supply constraints from China too pushed up prices.
As cash flows improved, steel companies started repaying loans. This was the time to further add to positions.
2021 - Steel prices kept rising on the back of strong demand and supply constraints. Output from China declined leading to supply challenges.
As a result, Indian steel companies saw their revenues spike. Companies used these cashflows to further repay debt. Stocks prices soared.
2022 - Demand started to moderate as interest rates went up. Steel prices corrected 20-25% from the peak (after 3x rise from the bottom). Stock prices started falling.
Key Points to Keep in Mind While Investing in Steel Stocks
Here are some key points to take note of before you invest in steel stocks
#1 Cyclicality of the sector
This is the most important factor one must keep in mind while investing in steel stocks.
Since steel stocks are cyclical, the best time to buy them is at the start of an economic expansion. The best time to sell them is just before the economy begins to slow down.
Investing in a steel stock at the peak of an economic cycle could result in a huge chunk of the investment being wiped it. Nevertheless, identifying the bottom of the cycle is not an easy task.
#2 Profitability of the company
Steel companies with a larger presence in contract sales and value-added products are insulated to a great extent from the steel cycle and have healthier profit margins.
Before you compare the performance of two steel companies, say for instance, Tata Steel vs JSW Steel, do factor in the operating performance.
Here's a list of top metal and steel companies in India based on their consolidated net profit.
| Company Name | Net Sales (Rs m) | Operating Profit (Rs m) | Consolidated Net Profit (Rs m) |
|---|---|---|---|
| Tata Steel Ltd. | 24,39,592 | 6,42,748 | 4,01,539 |
| JSW Steel Ltd. | 14,63,710 | 4,05,380 | 2,06,650 |
| Vedanta Ltd. | 13,27,320 | 4,74,240 | 1,88,020 |
| Hindalco Industries Ltd. | 19,50,590 | 2,94,830 | 1,37,300 |
| Hindustan Zinc Ltd. | 2,94,400 | 1,74,410 | 96,290 |
| ISMT Ltd. | 21,606 | 823 | 23,742 |
| Welspun Corp Ltd. | 65,051 | 10,229 | 4,388 |
| Ratnamani Metals & Tubes Ltd. | 31,388 | 5,325 | 3,226 |
| Usha Martin Ltd. | 26,881 | 4,189 | 2,913 |
| Kalyani Steels Ltd. | 17,060 | 3,900 | 2,441 |
Data as of March 2022
#3 Exports as a percentage of revenue
Steel companies that earn a large share of their revenue from exports have better margins as international prices tend to be higher than domestic prices.
#4 Debt to equity (D/E) ratio
A company uses both equity and debt to run a business. However, the amount of debt it uses indicates its fixed obligations. Higher the leverage, higher will be the fixed charges such as interest expense which will lower the profitability.
One must look for a debt to equity ratio of one or less than one.
Here's a list of top metal and steel companies in India with low debt to equity ratio.
| Company | Debt to Equity (x) |
|---|---|
| JSW Steel Ltd. | 0.80 |
| Tata Steel Ltd. | 0.26 |
| Hindustan Zinc Ltd. | 0.09 |
| Vedanta Ltd. | 0.59 |
| Hindalco Industries Ltd. | 0.39 |
| Ratnamani Metals & Tubes Ltd. | 0.07 |
| Lloyds Metals & Energy Ltd. | 0.20 |
| Welspun Corp Ltd. | 0.43 |
| Usha Martin Ltd. | 0.18 |
| Tinplate Company Of India Ltd. | 0.00 |
Data as of March 2022
#5 Return on Capital Employed (ROCE) ratio
Along with a low debt to equity ratio, a one must look for a high return on capital employed (ROCE).
Return on capital employed measures how much profits the company is generating through its capital. The higher the ratio, the better.
An ROCE of above 15% is considered decent for companies that are in an expansionary phase.
Here's a list of top metal and steel companies in India with more than 15% in ROCE.
| Company | ROCE (%) |
|---|---|
| Tinplate Company Of India Ltd. | 47.5 |
| Hindustan Zinc Ltd. | 37.4 |
| Tata Steel Ltd. | 33.0 |
| Usha Martin Ltd. | 27.1 |
| JSW Steel Ltd. | 26.9 |
| Tata Metaliks Ltd. | 25.7 |
| Lloyds Metals & Energy Ltd. | 22.7 |
| Ratnamani Metals & Tubes Ltd. | 19.7 |
| Vedanta Ltd. | 19.1 |
| Welspun Corp Ltd. | 17.7 |
Data as of March 2022
#6 Valuations
Two commonly used financial ratios used in the valuation of steel stocks are -
Price to Earnings Ratio (P/E) - It compares the company's stock price with its earnings per share. The higher the P/E ratio, the more expensive the stock.
To find stocks with favorable P/E Ratios, check out our list of stocks according to their P/E Ratios.
Price to Book Value Ratio (P/BV) - It compares a firm's market capitalization to its book value. A high P/BV indicates markets believe the company's assets to be undervalued and vice versa.
To find stocks with favorable P/BV Ratios, check out our list of stocks according to their P/BV Ratios.
#7 Dividend yields
There is no consistent trend of dividends across the industry, with different companies having different dividend policies.
Here's a list of top metal and steel companies in India that score well on dividend yield and dividend payout.
| Company | Dividend Yield (eoy) | Dividend Payout (%) |
|---|---|---|
| Vedanta Ltd. | 11.2 | 89.0 |
| Hindustan Zinc Ltd. | 5.8 | 79.0 |
| Welspun Corp Ltd. | 3.0 | 29.7 |
| Usha Martin Ltd. | 1.5 | 20.9 |
| Ratnamani Metals & Tubes Ltd. | 0.5 | 20.3 |
| JSW Steel Ltd. | 2.4 | 20.2 |
Data as of March 2022
For more details, check out the top stocks offering high dividend yields.
Top Steel Stocks in India
The steel sector is in its growth phase. The top steel stocks in India can immensely benefit with so many factors positively affecting the industry.
Here are the top steel stocks in India which score well on crucial parameters.
| Company | P/E (x) | RoE (Latest, %) | D/E (Curr FY, x) | Sales CAGR (3 yrs, %) | Profit CAGR (3 yrs, %) |
|---|---|---|---|---|---|
| JSW STEEL | 10.6 | 29.9% | 1.0 | 20.0% | 38.4% |
| TATA STEEL | 3.4 | 35.9% | 0.6 | 13.4% | 66.7% |
| JINDAL STEEL & POWER | 5.2 | 13.4% | 0.9 | 17.0% | NM |
| SAIL | 2.7 | 8.1% | 0.8 | 7.2% | NM |
| APL APOLLO TUBES | 44.8 | 24.1% | 0.3 | 17.8% | 37.1% |
| RATNAMANI METALS | 37.3 | 14.4% | 0.1 | 4.4% | 8.5% |
| SHYAM METALICS AND ENERGY | 4.6 | 23.2% | 0.2 | 19.9% | 17.0% |
| APOLLO TRICOAT TUBES | 48.5 | 34.5% | 0.2 | 97.5% | 146.9% |
For more details, check out Equitymaster's Powerful Indian stock screener for filtering the best steel stocks in India.
List of Steel Stocks in India
The details of listed steel companies can be found on the NSE and BSE website. However, the overload of financial information on these websites can be overwhelming.
For a more direct and concise view of this information, you can check out our list of steel stocks.
You can also read our steel sector report and check the latest steel sector results.
You can also checkout our playlist on Steel Stocks on Equitymaster's YouTube channel.
Best Sources for Information on the Steel Sector
World Steel Association - https://worldsteel.org/
Ministry of Steel - https://steel.gov.in/overview-steel-sector
Indian Brand Equity Foundation Steel Sector Report - https://www.ibef.org/industry/steel
![]() Why Tata Steel Share Price is Falling
Why Tata Steel Share Price is Falling
Nov 14, 2024
Here's why even after posting a big jump in quarterly net profit Tata Steel continues to be under pressure.
![]() Top 4 Stocks Poised to Benefit from the Potential Revival of Chinese Economy
Top 4 Stocks Poised to Benefit from the Potential Revival of Chinese Economy
Oct 5, 2024
Explore the top four stocks that stand to gain from the anticipated revival of the Chinese economy, driven by government stimulus and increased steel demand.
![]() Top 5 Stocks Held by Dolly Khanna Under Rs 250
Top 5 Stocks Held by Dolly Khanna Under Rs 250
Oct 2, 2024
Dolly Khanna's portfolio is diversified across various sectors, including small and mid-cap holdings in textiles, pipes, steel, breweries, and distilleries.
![]() Why Rama Steel Tubes Share Price is Falling
Why Rama Steel Tubes Share Price is Falling
Aug 28, 2024
Find out why this steel company's share price tumbled 6% in the last five days.
![]() Why Tata Steel Share Price is Rising
Why Tata Steel Share Price is Rising
Jun 10, 2024
Here's why Tata Steel share price is rallying despite reporting weak results.
![]() 5 High Dividend Stocks Up More Than 80% in 2024
5 High Dividend Stocks Up More Than 80% in 2024
May 12, 2024
Dividend stocks are making sense now. Here are 5 which have also performed well on the bourses in 2024 so far.
![]() Why SAIL Share Price is Rising
Why SAIL Share Price is Rising
Apr 25, 2024
Investors are fancying SAIL over peers Tata Steel and JSW owing to cheaper valuations. There's more to the story though...
![]() Green Hydrogen Stocks Could Soar in Next Decade
Green Hydrogen Stocks Could Soar in Next Decade
Apr 5, 2024
The quest to hit net zero by 2050 is generating interest in clean hydrogen, which also has the potential to decarbonize hard-to-abate sectors such as steel, chemicals, and shipping.
![]() Top Performing Steel Stocks of FY24
Top Performing Steel Stocks of FY24
Mar 29, 2024
Indian steel stocks have been quietly delivering impressive returns. Here are the top five that dominated the market in FY24.
![]() 5 Best Steel Penny Stocks in India
5 Best Steel Penny Stocks in India
Feb 17, 2024
Given the sector's critical role in India's burgeoning economy, the potential for exponential gains makes these penny stocks worth the attention.
![]() 3:1 Bonus Shares Alert: Multibagger Engineering Stock to Trade Ex-Bonus Soon
3:1 Bonus Shares Alert: Multibagger Engineering Stock to Trade Ex-Bonus Soon
Nov 8, 2024
For the first time in its history, this engineering company is issuing a bonus shares. More details inside.
![]() Why NALCO Share Price is Rising
Why NALCO Share Price is Rising
Oct 3, 2024
The stock is up 25% in less than a month. More gains ahead?
![]() From Vedanta to NALCO: Why Metals Stocks Are Rising
From Vedanta to NALCO: Why Metals Stocks Are Rising
Sep 25, 2024
Here's why all metal stocks are on an upward trajectory.
![]() Why Tata Steel Share Price is Falling
Why Tata Steel Share Price is Falling
Aug 14, 2024
Here's why Tata Steel along with all mining stocks are under pressure after the Supreme Court order.
![]() This Tata Stock is Shining at the Right Time
This Tata Stock is Shining at the Right Time
May 21, 2024
This is why Tata Steel's stock price has caught the attention of the market.
![]() After Tata can This Business Group Create Wealth?
After Tata can This Business Group Create Wealth?
May 1, 2024
Aditya Birla Group announces multiple strategic decisions. How can you profit?
![]() Best Metal Stock: JSW Steel vs Tata Steel vs Hindalco
Best Metal Stock: JSW Steel vs Tata Steel vs Hindalco
Apr 11, 2024
All major government policies, including Make in India, smart cities, and rural electrification, are driving the demand for metals in India, and these three metals companies are leading the way.
![]() Multibagger Alert! 5 Stocks that Rallied Over 1,000% in Financial Year 2024
Multibagger Alert! 5 Stocks that Rallied Over 1,000% in Financial Year 2024
Mar 30, 2024
These 5 stocks made headlines by skyrocketing in the financial year 2023-24. More gains ahead or a possible downturn?
![]() Best Steel Stock: APL Apollo Tubes vs Ratnamani Metals
Best Steel Stock: APL Apollo Tubes vs Ratnamani Metals
Feb 21, 2024
India's steel pipe industry is expected to grow at a CAGR of 9% in the next five years. And this pipe manufacturing company has a competitive advantage compared to its listed peers.
![]() Not Tata Motors or Tata Power...This is the Top Performing Tata Group Stock of 2024
Not Tata Motors or Tata Power...This is the Top Performing Tata Group Stock of 2024
Feb 9, 2024
Here's why this Tata group stock zoomed 20% after withdrawing amalgamation plans with Tata Steel.
FAQs
Which are the top steel companies in India right now?
As per Equitymaster's Stock Screener, here is a list of the top steel companies in India right now...
These companies have been ranked as per their market capitalization. The higher the market cap, the higher the total value of the company.
Of course, there are other parameters you should take into account before forming a hard opinion on the stock valuation.
When should you invest in the steel sector?
Steel stocks are usually risker as their fortunes are prone to economic booms and busts. For this reason, they are called cyclical stocks. Cyclical stocks do well when the economy is doing well and vice versa.
However, before selecting a stock, one must check whether the industry is due for revival or not.
Where can I find a list of steel stocks?
The details of listed steel companies can be found on the NSE and BSE website. For a curated list, you can check out our list of steel stocks.
How should you value steel companies?
Investing in stocks requires careful analysis of financial data to find out a company's true worth. However, an easier way to find out about a company's performance is to look at its financial ratios.
Two commonly used financial ratios used in the valuation of stocks are -
Price to Earnings Ratio (P/E) - It compares the company's stock price with its earnings per share. The higher the P/E ratio, the more expensive the stock.
To find stocks with favorable P/E Ratios, check out our list of steel stocks according to their P/E Ratios.
Do keep in mind that in case of cyclical stocks like steel stocks, sometimes a lower P/E ratio may not signal a cheap stock...it could among other thing be signalling peak earnings which are usually seen at the top of the steel sector cycle.
Price to Book Value Ratio (P/BV) - It compares a firm's market capitalization to its book value. A high P/BV indicates markets believe the company's assets to be undervalued and vice versa.
To find stocks with favourable P/BV Ratios, check out our list of steel stocks according to their P/BV Ratios.


