Our Big Prediction
This Could be One of the Exciting Opportunities for Investors
- Home
- Outlook Arena
- Top Cement Stocks in India
Top Cement Stocks in India
India is the second largest producer of cement in the world. According to IBEF, the Indian cement capacity accounts for more than 7% of the global installed capacity.
At present, the country boasts an installed capacity of is 500 MTPA (million tonnes per annum) with production of 298 MTPA.
The domestic cement demand is well poised for a surge. With high allocation under the Union Budget 2022-23 for infrastructure, affordable housing schemes and road projects to fuel the economy, the cement production in India is expected to grow at 1.4 time of the real GDP.
Porter's Five Forces Analysis of the Cement Sector in India
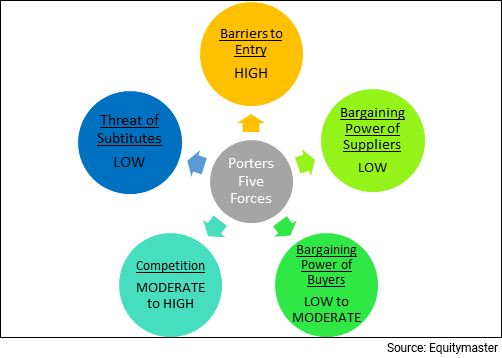
Porter's Five Forces is a model that identifies and analyzes five competitive forces that shape every industry.
These are barriers to entry, bargaining power of suppliers, bargaining power of customers, threat of substitutes and competition within the industry.
A change in any of the forces normally requires a company to re-assess the marketplace.
Let us have a look at how these five forces shape the cement sector:
#1 Barriers to Entry
The most attractive segment is one in which barriers to entry are high as they restrict the threat of new entrants.
Conversely if the barriers are low, the risk of new companies venturing into a given market is high.
In the cement sector, barriers to entry are high, as plant set up, land and the development of limestone and coal mines requires large capital investment. Moreover, the unavailability of land near mines causes more hindrance.
#2 Bargaining Power of Suppliers
The bargaining power of customers is the ability of suppliers to put the firm under pressure. Suppliers may refuse to work with the firm or charge excessively high prices for unique resources.
Even though the top 20 players account for 70% of the total cement capacity, the bargaining power of suppliers is low due to the presence of several other small and medium size players spread across the region.
#3 Bargaining Power of Customers
The bargaining power of customers is the ability of customers to put the firm under pressure. It is high if buyers have many alternatives and low if they have few choices.
In the cement sector, the bargaining power of customers is low to moderate. Demand/ supply imbalance determines the price of commodities. Major customers typically negotiate prices based on current market levels.
#4 Competition
For most industries, having an understanding of the competition is vital to successfully marketing a product.
Although the competition in the cement industry is moderate to high due to the presence of several smaller players, it is far better than it used to be.
#5 Threat of Substitutes
A substitute product uses a different technology to try to solve the same economic need.
This is low for the cement sector, as there are no substitutes to cement.
Porters Five Forces Analysis of the Cement Sector in India
When to Invest in Cement Stocks
Cement stocks are usually risker as their fortunes are prone to economic booms and busts. For this reason, they are called cyclical stocks.
Generally considered an offensive tactic in investing, cyclical stocks can be used to generate high returns when the economy is doing well.
However, before selecting a stock, check to see whether the industry is due for revival or not.
Key Points to Keep in Mind While Investing in Cement Stocks
Here are some key points to take note of before you invest in cement stocks:
#1 Cyclicality of the sector
This is the most important factor one must keep in mind while investing in cement stocks.
Since cement stocks are cyclical, the best time to buy them is at the start of an economic expansion. The best time to sell them is just before the economy begins to slow down.
Investing in a cement stock at the peak of an economic cycle could result in a huge chunk of the investment being wiped it. Nevertheless, identifying the bottom of the cycle is not an easy task.
#2 Profitability of the company
Cement companies with a pan India presence are insulated from concentration risk and thus may generate healthier profit margins.
Cement companies operate within their region considering cement cannot travel long distances. So, for some reason, if a single region does not perform well, the others act as a buffer.
Therefore, before you compare the performance of two cement companies, say for instance, Ultratech vs Shree Cement, do factor in their regional exposure.
Here's a list of top cement companies in India based on their consolidated net profit.
| Company | Net Sales (Rs m) | Operating Profit (Rs m) | Consolidated Net Profit (Rs m) |
|---|---|---|---|
| Ultratech Cement Ltd. | 5,06,635 | 1,15,482 | 70,665 |
| Shree Cement Ltd. | 1,43,059 | 41,852 | 23,766 |
| Ambuja Cements Ltd. | 1,39,650 | 34,931 | 20,805 |
| ACC Ltd. | 1,61,514 | 32,052 | 18,203 |
| The Ramco Cements Ltd. | 59,800 | 13,151 | 8,927 |
| JK Cement Ltd. | 76,786 | 16,249 | 6,307 |
| JK Lakshmi Cement Ltd. | 50,408 | 8,685 | 4,262 |
| Orient Cement Ltd. | 27,254 | 6,006 | 2,633 |
| Heidelberg Cement India Ltd. | 22,970 | 4,836 | 2,523 |
| HIL Ltd. | 19,735 | 3,066 | 1,858 |
Data as of March 2022
#4 Debt to equity (D/E) ratio
A company uses both equity and debt to run a business. However, the amount of debt it uses indicates its fixed obligations. Higher the leverage, higher will be the fixed charges such as interest expense which will lower the profitability.
One must look for a debt to equity ratio of one or less than one.
Here's a list of top cement companies in India with low debt to equity ratio.
| Company | Debt to Equity (x) |
|---|---|
| Ultratech Cement Ltd. | 0.2 |
| Ambuja Cements Ltd. | 0 |
| Shree Cement Ltd. | 0.12 |
| ACC Ltd. | 0 |
| Dalmia Bharat Ltd. | 0 |
| JK Cement Ltd. | 0.76 |
| The Ramco Cements Ltd. | 0.6 |
| Nuvoco Vistas Corporation Ltd. | 0.4 |
| JK Lakshmi Cement Ltd. | 0.39 |
| Heidelberg Cement India Ltd. | 0.12 |
| HIL Ltd. | 0.06 |
Data as of March 2022
#5 Return on Capital Employed (ROCE) ratio
Along with a low debt to equity ratio, a one must look for a high return on capital employed (ROCE).
Return on capital employed measures how much profits the company is generating through its capital. The higher the ratio, the better.
An ROCE of above 15% is considered decent for companies that are in an expansionary phase.
Here's a list of top cement companies in India with more than 15% in ROCE.
| Company | ROCE (%) |
|---|---|
| Shree Digvijay Cement Company Ltd. | 28.77 |
| Sahyadri Industries Ltd. | 25.93 |
| HIL Ltd. | 23.87 |
| Orient Cement Ltd. | 23.13 |
| Visaka Industries Ltd. | 20.99 |
| Heidelberg Cement India Ltd. | 20.97 |
| KCP Ltd. | 20.91 |
| JK Lakshmi Cement Ltd. | 19.79 |
| ACC Ltd. | 18.71 |
| Deccan Cements Ltd. | 17.25 |
| Shree Cement Ltd. | 17.17 |
| JK Cement Ltd. | 17.09 |
Data as of March 2022
#6 Valuations
Two commonly used financial ratios used in the valuation of steel cement stocks are -
Price to Earnings Ratio (P/E) - It compares the company's stock price with its earnings per share. The higher the P/E ratio, the more expensive the stock.
To find stocks with favorable P/E Ratios, check out our list of stocks according to their P/E Ratios.
Price to Book Value Ratio (P/BV) - It compares a firm's market capitalization to its book value. A high P/BV indicates markets believe the company's assets to be undervalued and vice versa.
To find stocks with favorable P/BV Ratios, check out our list of stocks according to their P/BV Ratios.
#7 Dividend yields
There is no consistent trend of dividends across the industry, with different companies having different dividend policies.
Here's a list of top cement companies in India that score well on dividend yield and dividend payout.
| Company | Dividend Yield (eoy) | Dividend Payout (%) |
|---|---|---|
| Shree Digvijay Cement Company Ltd. | 5.1 | 91.2 |
| Heidelberg Cement India Ltd. | 4.8 | 80.8 |
| ACC Ltd. | 2.6 | 59.8 |
| Visaka Industries Ltd. | 2.6 | 21.9 |
| Orient Cement Ltd. | 1.8 | 19.5 |
| Ambuja Cements Ltd. | 1.7 | 60.1 |
| HIL Ltd. | 1.6 | 26.3 |
| Sahyadri Industries Ltd. | 1.4 | 9.5 |
| JK Lakshmi Cement Ltd. | 1.1 | 13.8 |
Data as of March 2022
For more details, check out the top stocks offering high dividend yields.
Top Cement Stocks in India
The cement sector is in its growth phase. The top cement stocks in India can immensely benefit with so many factors positively affecting the industry.
Here are the top cement stocks in India which score well on crucial parameters.
| Company | RoE (Latest, %) | D/E (Curr FY, x) | Sales CAGR (3 yrs, %) | Profit CAGR (3 yrs, %) | P/E (x) |
|---|---|---|---|---|---|
| ACC | 17.8 | 0 | 2.9 | 7.1 | 36.6 |
| Ambuja Cement | 14.6 | 0.1 | 3.6 | 7.6 | 33.9 |
| Ultratech | 16.7 | 0.1 | 8.1 | 44.1 | 26.5 |
| Shree Cement | 16.6 | 0.1 | -3.5 | 32.1 | 42.3 |
| Ramco Cement | 9.7 | 0.4 | 4.9 | 20.7 | 21.5 |
| JK Cement | 17.5 | 0.7 | 14.9 | 37.1 | 33.7 |
For more details on cement stocks such as steel stocks, check out Equitymaster's Powerful stock screener for filtering the best cement stocks in India.
List of Cement Stocks in India
The details of listed cement companies can be found on the NSE and BSE website. However, the overload of financial information on these websites can be overwhelming.
For a more direct and concise view of this information, you can check out our list of cement stocks.
Best Sources for Information on the Cement Sector
Indian Brand Equity Foundation Cements and Mining Sector Report - https://www.ibef.org/industry/cements-and-mining
So, there you go. Equitymaster's detailed guide on the top cement stocks in India is simple and easy to understand. At the same time, it offers detailed analysis of both the sector and the top stocks in the sector.
You can also checkout our playlist on Cement Stocks on Equitymaster's YouTube channel.
Here's a list of articles and videos on the cement sector and top cement stocks in India. This is a great starting point for anyone who is looking to explore more about cement stocks and the cement sector.
Disclaimer: This article is for information purposes only. It is not a stock recommendation and should not be treated as such. Learn more about our recommendation services here...
![]() New Winners in the Cement Sector in India
New Winners in the Cement Sector in India
Aug 4, 2024
Which are the top cement manufacturing companies in India? Find out...
![]() Top 5 Cement Picks for India's Growth Story
Top 5 Cement Picks for India's Growth Story
Dec 22, 2023
After a slowdown in the last decade, there is a revival in cement demand, powered by a confluence of factors.
![]() Dolly Khanna Trims Stake in this Smallcap Stock in Q4. Do You Own?
Dolly Khanna Trims Stake in this Smallcap Stock in Q4. Do You Own?
Apr 11, 2023
Known for picking undervalued stocks from the midcap and smallcap space, Dolly Khanna recently trimmed her stake in this company.
![]() Top 5 Cement Companies in India by Growth
Top 5 Cement Companies in India by Growth
Nov 26, 2022
These five cement companies are worth keeping an eye on.
![]() Should You Hop into Cement Stocks?
Should You Hop into Cement Stocks?
Nov 7, 2022
How to profit from sector rotation as a trader.
![]() Cement Sector for Long-term Investment?
Cement Sector for Long-term Investment?
Jul 27, 2022
In the past 10 years, the cement industry's performance has remained dormant. But I believe this is set to change.
![]() 10 Things to Know About the Adani-Holcim Deal
10 Things to Know About the Adani-Holcim Deal
May 16, 2022
The Adani Group outbids cement major UltraTech and others to foray into cement as the second-largest player in the country.
![]() UltraTech Delivers Strong Results. Will the Stock Continue to Rise?
UltraTech Delivers Strong Results. Will the Stock Continue to Rise?
Jul 23, 2021
A key highlight for the June quarter was the company paying long-term loans amounting to Rs 50 bn in advance.
A Close Look at the Stock of JK Lakshmi Cement
May 21, 2021
A key highlight of the company's Q4 results was its healthy operating performance.
![]() UltraTech's Acquisition of India Cements or Ambuja's Penna Deal - Which One is Better?
UltraTech's Acquisition of India Cements or Ambuja's Penna Deal - Which One is Better?
Jul 29, 2024
The trend of large, pan India cement players acquiring south-based players is gaining strength.
![]() Why Shree Cement Share Price is Falling
Why Shree Cement Share Price is Falling
Jun 27, 2023
The stock is down more than 8% in the last five days. Here's why.
![]() Why ACC Share Price is Falling
Why ACC Share Price is Falling
Feb 23, 2023
The recently acquired cement firm of Adani Group, ACC hit a multi-month low. Here's why.
![]() How Cement Stocks are Looking on the Charts
How Cement Stocks are Looking on the Charts
Nov 15, 2022
Should you hop on to cement stocks?
![]() Why Cement Stocks are Rising
Why Cement Stocks are Rising
Sep 8, 2022
Falling input costs among other reasons are driving cement stocks higher. But what next?
![]() Why Cement Stocks are Falling
Why Cement Stocks are Falling
Jun 7, 2022
Shares of cement companies have hit their 52 week lows due to this reason.
![]() 4 Cement Stocks Poised to Benefit from India's Capex Boom
4 Cement Stocks Poised to Benefit from India's Capex Boom
Feb 11, 2022
Will the government's significant infrastructure push boost cement demand?
![]() Cement Stocks on a Roll: JK Lakshmi Cement & Ambuja Cement Scale New High
Cement Stocks on a Roll: JK Lakshmi Cement & Ambuja Cement Scale New High
Jul 6, 2021
Cement stocks rally owing to firm cement prices and volume growth expectation.
Identifying a cement stock: Do's and don'ts
Nov 29, 2003
One of the key factors that seem to have a major say on stock price movements of cement companies are cement prices! Given the volatility and seasonality involved in the same, should one place such high weightage on cement prices to ascertain investment decision in cement stocks? Here is an attempt to simplify the analysis of a cement company.
FAQs
Which are the top cement companies in India?
Based on marketcap, these are the top cement companies in India:
- #1 ULTRATECH CEMENT
- #2 AMBUJA CEMENT
- #3 SHREE CEMENT
- #4 ACC
- #5 DALMIA BHARAT
You can see the full list of the cement stocks here.
And for a fundamental analysis of the above companies, check out Equitymaster’s Indian stock screener which has a separate screen for top cement stocks in India.
What are the top gainers and top losers within the cement sector today?
Within the Cement sector, the top gainers were KEERTHI INDUSTRIES (up 20.0%) and INDIAN HUME PIPE (up 5.3%). On the other hand, EVEREST INDUSTRIES (down 3.3%) and KANORIA ENERGY & INFRASTRUCTURE (down 2.0%) were among the top losers.
You can also take a look at the most active stocks from the cement sector and also check out our cement sector report.
How should you value cement companies?
Investing in stocks requires careful analysis of financial data to find out a company's true worth. However, an easier way to find out about a company's performance is to look at its financial ratios.
Two commonly used financial ratios used in the valuation of stocks are -
Price to Earnings Ratio (P/E)- It compares the company's stock price with its earnings per share. The higher the P/E ratio, the more expensive the stock.
Price to Book Value Ratio (P/BV) - It compares a firm's market capitalization to its book value. A high P/BV indicates markets believe the company's assets to be undervalued and vice versa.
Where can I find a list of cement stocks?
The details of listed cement companies can be found on the NSE and BSE website. For a curated list you can check out our list of cement stocks.


