Our Big Prediction
This Could be One of the Exciting Opportunities for Investors
- Home
- Todays Market
- Indian Stock Market News February 27, 2021
Nifty is Weak but Smallcaps Can Outperform Sat, 27 Feb Momentum Moves
The Week Gone By
The market see-sawed during the week with both the bulls and bears swinging it out.
But in the end, it was the bears who won. The Nifty ended the day, the week, and the month at 14,529.15.
Energy, PSU Banks, Financials, Metals and Realty sectors ended the month on positive note.
We highlighted on 13th February 2020 about how the Nifty and Nasdaq could reverse.
Here we are, the Nifty down by 6% from its high whereas the Nasdaq is down by more than 7%.
The Week Ahead: February Starts with Bulls but Ends with Bears
The belief on technical levels is hard to digest by most of the players in the markets but if you believe me, you know how much wealth you can make analysing charts.
In our previous weekly edition of Momentum Moves, we highlighted index was trading at the upper band of the rising channel and at multiple Fibonacci levels. It played exactly as we had discussed.
Markets never go up in a straight line. Dips are a part of it.
But predicting the right reversal level is the trader's game to make it big!
We saw many candlestick patterns last week like the Bearish Engulfing and Evening Star.
This week, we have the Bearish Island reversal on the daily chart.
Bearish Island pattern is when the price opens with a gap-up and then with a gap-down on the following day, forming a gap with three candles.
In our previous edition of Momentum Moves we highlighted the resistance on the rising channel at 15,370. The index has reversed and is now heading lower.
The lower or support line of the channel is placed at the key psychological level of 14,000.
The index has minor support at the 50 DEMA (Daily Exponential Moving Average) at 14,396 (orange line on chart).
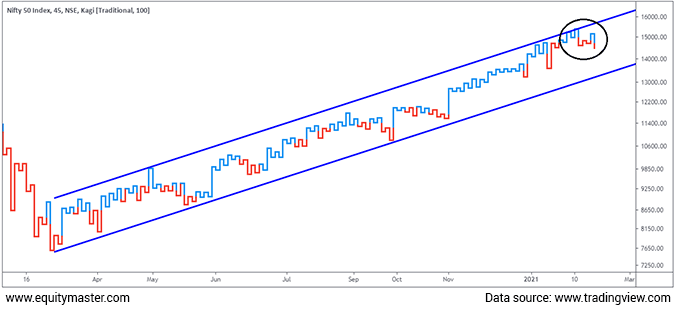
If we look at the short term Kagi chart, the bears have the upper hand.
Nifty Kagi Chart

This is the 45 minutes of 3 ATR (Average True Range) Kagi chart for a short term view on the Nifty.
The index has faced resistance on the short term rising channel and has formed a lower shoulder - lower waist (circled on chart).
This is a bearish reversal as per Dow Theory of technical analysis. The lower shoulder - lower waists are basically lower high - lower low structure as per the bar chart.
The bearish structure of lower high - lower low can be negated only above 15,167 which is previous shoulder.
If we look at the weekly and daily chart for last couple of weeks, the first half of March will be led by the bears to test 14k levels.
The second half can be range bound between 13,900-15,000 on the Nifty.
Smallcaps to Outperform
When D-street is trading at all-time highs, most investors focus on midcaps and smallcaps as they multiply faster than large caps.
Are you also in search of such stocks?
I believe that every index has its own time, and one should look to invest when you find best time to invest in such indices.
Holding period and opportunity costs matter in trading and investing.
In our Fast Profits Daily video, we have covered this chart, but we like to highlight it again here as we don't want you to miss this opportunity in smallcaps.
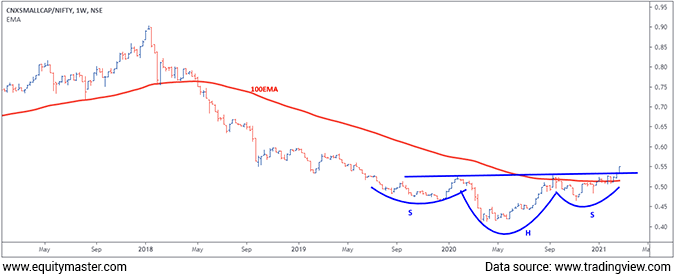
CNX Smallcap Versus Nifty Weekly Ratio Chart

Smallcap to Nifty ratio weekly chart highlights everything for bulls in smallcap index.
The ratio chart above is Smallcap / Nifty which are used to identify the outperformance / underperformance of the smallcap index over the Nifty.
When the ratio goes higher, Smallcaps outperforms and vice versa.
Inverted or Bullish Head & Shoulder pattern has formed on this chart (blue lines marked) which is a bottoming formation.
When the price breaks above the neckline, the bottom is confirmed, and the price tends to go higher. In this case, the ratio is broken above 0.52 after a two-year long bearish trend.
The ratio rising means smallcaps will outperform Nifty. We are expecting this outperformance for a couple of quarters.
Investors must look at increasing their allocation in smallcaps over large cap for better returns.
Conclusion
Nifty has reversed from the crucial resistance zone as we highlighted in our previous edition.
The bears are leading the way towards 14,000 levels. Traders should look for sell-on-rise strategy if the index is your focus. The stock specific action might continue to trend in its own way.
Smallcap index has formed a bottom after a couple of bearish years and likely to outperform Nifty in next couple of quarters. Investors should look to increase their allocation in smallcaps over largecaps.
For information on how to pick stocks that have the potential to deliver big returns, download our special report now!
Read the latest Market Commentary


Equitymaster requests your view! Post a comment on "Nifty is Weak but Smallcaps Can Outperform". Click here!
Comments are moderated by Equitymaster, in accordance with the Terms of Use, and may not appear
on this article until they have been reviewed and deemed appropriate for posting.
In the meantime, you may want to share this article with your friends!