Our Big Prediction
This Could be One of the Exciting Opportunities for Investors
- Home
- Todays Market
- Indian Stock Market News February 13, 2021
Nasdaq & Nifty Could Reverse Sat, 13 Feb Momentum Moves
The Week Gone By
We've seen a stellar rally post budget and then a rangebound week with a slight bullish bias.
Nifty firmly held 15,000 but the bulls seem to be tiring now. The breadth of large-cap stocks is not convincing enough to hold market at higher levels.
Sectors which led in the budget week witnessed profit booking. Overall, we had mixed bag of sectors performing in the range of +3% to -2%.
In this week's video, I elaborate on these points and what you should expect in the coming week.
Nifty at Multiple Technical Resistance levels
Nifty after gaining nearly 9% in the budget week, has seen a pause in momentum above 15,000 levels.
The index has just approached the multiple resistance zone placed at 15,200-15,370 levels.
Nifty Weekly Chart

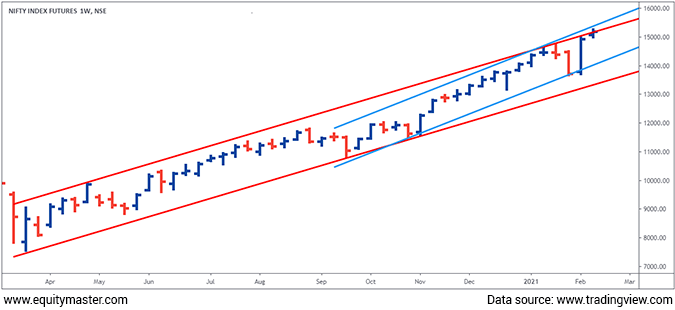
This is a weekly Nifty futures continuous chart. It highlights the point that the index is trading at resistance of multiple rising channels.
The red channel is drawn from the lows of March 2020 which is nearly 11 months old. Index is trading within that channel and currently trading at the upper band.
Similarly, the blue channel connected from the lows of September 2020 has a resistance at 15,370 levels.
Nifty futures have hit all-time high of 15,266 last week which is near the resistance level.
Bears now have an opportunity here to attack bulls as the index is trading at a crucial resistance level.
A fall below 14,938 will confirm the short term downtrend for the market. If that happens next week then a test of 14,400 can be on cards which is the lower line of blue rising channel.
IT Index to Follow the Nasdaq 100
Indian IT index was one of the best outperforming indices in 2020 gaining 55%.
The index has been consolidating since last couple of weeks after a rally of 32% from November 2020 to January 2021.
If we compare Indian IT index with US Nasdaq 100 index which comprises of 50% IT stocks, the move has been similar.
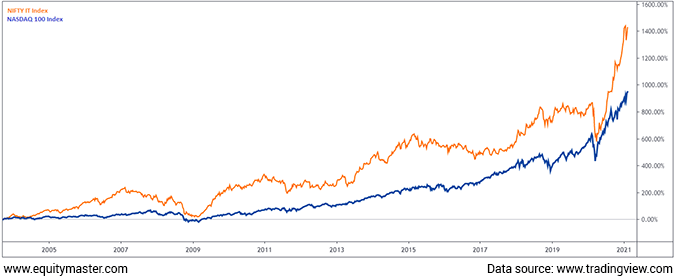
Being a follower of the US markets, I know that the Indian indices move in tandem with global indices. The chart below shows the similarity in the moves of the Nasdaq 100 and Nifty IT index.
NASDAQ 100 Versus Nifty IT Index

The percentage of rise may vary for IT index compared to Nasdaq, but they follow in step while rising and falling.
You might be wondering why I am discussing the Nasdaq index here which has been one of the biggest outperformers of 2020.
That is because...
The Nasdaq 100 is at a key reversal level of harmonic trading patterns.
Nasdaq 100 had a stellar run during pandemic as it was the first benchmark index to hit a new all-time high in June 2020.
Most of the global indices followed in its footsteps and caught up with the Nasdaq and are now at par with 100% gains from the lows of March 2020.
NASDAQ 100 Weekly Chart

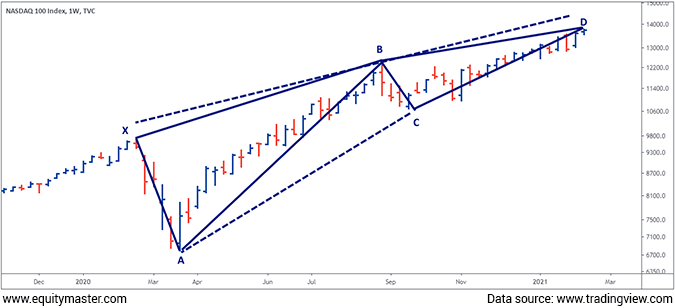
We are witnessing the bearish black swan harmonic pattern. This is reversal pattern.
Harmonic patterns are plotted using various Fibonacci retracements levels. The confluence of multiple Fibonacci levels forms various patterns. These patterns are of a reversal nature and helps traders to identify the probable top and bottom.
The above pattern is a Black Swan pattern which indicates the reversal zone of 13,750-13,967 as crucial reversal level.
The reversal from mentioned levels can take Nasdaq back to 12,200-12,600 levels which will be more than a 10% fall from highs.
Such a fall in the Nasdaq will have impact on Indian IT stocks which seem to be tiring at higher levels.
Nifty IT Chart

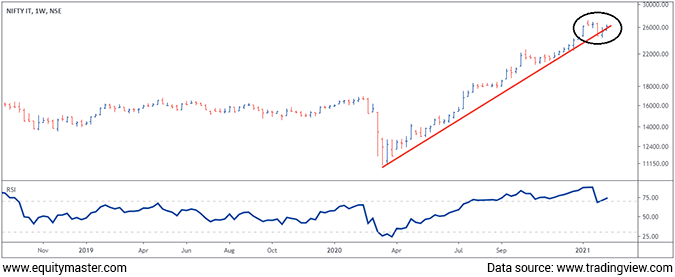
IT index has been struggling to go higher in the last 4-5 weeks.
The dumpling top candlestick pattern which marks the short term is visible on the weekly chart. This pattern will be negated on the crossing of 27,200. Till then, bears will have an upper hand on IT stocks.
The sell-on-rise strategy is good when a dumpling top structure is formed as it gives astonishing reward to traders willing to take the risk.
If in case the Nasdaq reverses in the next 1-2 weeks, IT index is likely to test 23,000-24,000 levels. It's currently trading at 26,300 levels.
Conclusion
Nifty is trading at a resistance of multiple rising channels which is placed 15,200-15,3700. The bulls seem to be tiring and if the index reverses from this resistance zone, a test of 14,000 can be on cards.
As a follower of US markets, I believe the Nifty might reverse if the Nasdaq 100 reverses from the reversal level of the harmonic pattern which is placed at 13,750-13,967.
Nasdaq and Nifty reversing will be double whammy for the IT index which has formed a bearish candlestick pattern.
For information on how to pick stocks that have the potential to deliver big returns, download our special report now!
Read the latest Market Commentary


Equitymaster requests your view! Post a comment on "Nasdaq & Nifty Could Reverse". Click here!
Comments are moderated by Equitymaster, in accordance with the Terms of Use, and may not appear
on this article until they have been reviewed and deemed appropriate for posting.
In the meantime, you may want to share this article with your friends!