Our Big Prediction
This Could be One of the Exciting Opportunities for Investors
- Home
- Todays Market
- Indian Stock Market News January 30, 2021
The Bulls Have to Fight Hard Going into the Budget Sat, 30 Jan Momentum Moves
The bears have attacked the Nifty hard causing the January F&O series to end in the red with the loss of 1.10%.
Last week in Momentum Moves, we highlighted the level of 14,200 below which bears would take control.
And here we are at 13,600 levels.
On the derivatives front, Nifty Futures rollover was at 77.28% versus an 75.94% while market wide rollover was at 91.23% versus 91.90%.
The Week Ahead
The January month is known for its tug of wars between the bulls and bears.
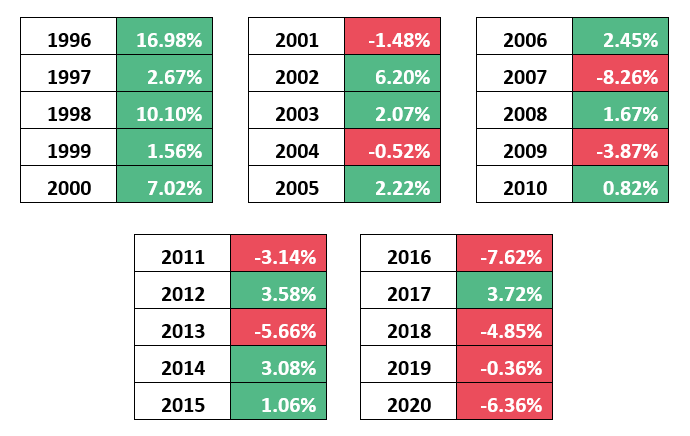
On the other hand February has historically been the month of the bulls.

In last 25 years, bulls ruled for 15 years while bears for 10 years. The average gain for 25 years is 0.92%.
After the stellar rally from the March 2020 lows of 7,511 to the all-time high of 14,753.35, the index took a pause in its momentum and fell below 14,000 levels.
For the first-time since September 2020, the index has retraced by more than 7% from its recent highs.
Bulls need to protect the support zone very hard going into Union Budget 2021.
Let's look at the Nifty chart...
Nifty Daily Chart

The 10 months rising trendline (blue line) on the chart above has support at 13,500. If we look at the 50 DEMA (Daily Exponential Moving Average), it's placed at 13,710.
Adding to the fuel, RSI (Relative Strength Index) in lower panel of the chart is also at a trendline support. This signals to us that the bulls may protect these levels.
If bulls failed to protect the support zone, we might head for 12,940.
Who can lead the next bullish wave?
In last 10 months of rally, we have witnessed sector rotation that has been fast and furious.
It started with Pharma and FMCG, moved to IT, Auto, and Cement but one leading sector is yet to show its true colours: Bank Nifty.
Bank Nifty to Nifty Ratio Daily Chart

Bank Nifty Outperformed Nifty between September to November 2020 but then lost its momentum.
The recent underperformance has retested the previous breakout levels and I believe it's time for Bank Nifty to come back strongly.
The weightage of Financial Services is around 39% in Nifty which can also hold its support of 13,500.
Also, if we have a look at Bank Nifty chart, it's indicating a bullish trend.
Bank Nifty Daily Chart

Index was trading in bullish or rising channel between June to November 2020.
The breakout at Rs 27,500 energised the bulls taking it all the way to 32,800 levels.
Bulls have an opportunity to re-enter longs in the current dip to 29,700 levels as it re-tests the breakout levels.
The breakout retest is a better price to enter as the risk-reward is favorable.
The retest is also supported by 50 DEMA at 30,306.
Conclusion:
The bulls need to protect 13,500-13,600 zone in Nifty for next bullish move.
Bank Nifty ratio chart is indicating the next leg may be led by banking stocks.
The Bank Nifty chart is on top of the world as the risk-reward is favorable for bulls.
Volatility is expected on Union Budget Day, but the bulls need to protect the levels mentioned above.
Traders should keep an eye on midcap banking stocks as midcaps are outperforming.
For information on how to pick stocks that have the potential to deliver big returns, download our special report now!
Read the latest Market Commentary


Equitymaster requests your view! Post a comment on "The Bulls Have to Fight Hard Going into the Budget". Click here!
Comments are moderated by Equitymaster, in accordance with the Terms of Use, and may not appear
on this article until they have been reviewed and deemed appropriate for posting.
In the meantime, you may want to share this article with your friends!