Goodbye US$ 100 Crude Oil

The days of triple digit crude oil prices seem to be history, at least in the short term.
Crude oil prices have fallen close to key technical support levels.
In this video I'll show you, with the help of my charts, why crude oil could crash.
Watch the video and let me know your thoughts on crude oil.
Hello subscribers. Welcome to the Fast Profits Daily. Myself, Brijesh Bhatia.
Commodity markets have been on a roll since the pandemic, I would say and the rally into the metals, crude, bullion, we have seen a tremendous rally.
Metals started slightly correcting after the first quarter of 2022. Crude oil, we saw three digit mark right from the pandemic negative levels during the 2020 pandemic lockdowns, a stellar rally, and now it's trading back below the three digit dollar mark now.
Dear Reader: If You Invest in Midcap Stocks, this is for You
I believe the short term top is on cards for crude oil and there are multiple reasons on the technical charts why I believe that the dollar 100 mark should be a goodbye levels for traders who are looking for a long bias.

Let's look at the first chart, why I'm saying so that the short term top can be on the cards.
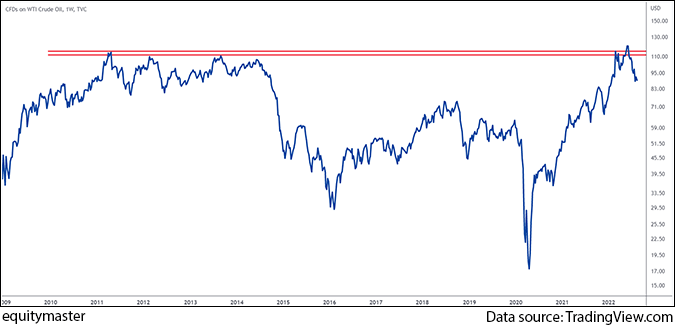
So if you look at the first chart over here, this is a weekly scale, weekly chart of the US oil, this spot crude oil chart into the dollar terms. If you look at the structure over here, we saw a resistance zone right of around 112-116 dollar mark. Again, this is the line chart. So it considers the closing levels.
We saw US$ 120 mark onto the trading side. If you look there was a breakout, which was a failure, we saw momentum coming back onto the negative side, again after the resistance zone. So prices acted at the resistance of 120-116 dollars zone and coming back very, very strongly back into the three digit mark.

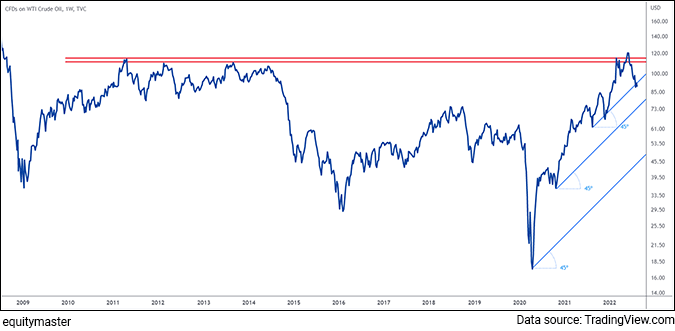
Second chart. I'll just add on the 45 degree support line over here. So if you look at the multiple swings, there are three 45-degree lines over here. 45 degree trendlines play a key important role. When there is a steep rally, in such kind of rally, 45 degree trendlines play a key important role in deciding the trend has changed, the momentum, which was there in a bullish scenario, has been changing.
So if you look at the top one, the 45 degree line, we have seen a close below that level in the last week's momentum. I believe once the previous swing low, below the 45 degree trend line is closed, so I believe a US$ 83 close, below the 83 dollar mark, would confirm that the 1st 45 degree trend line has been breached convincingly.

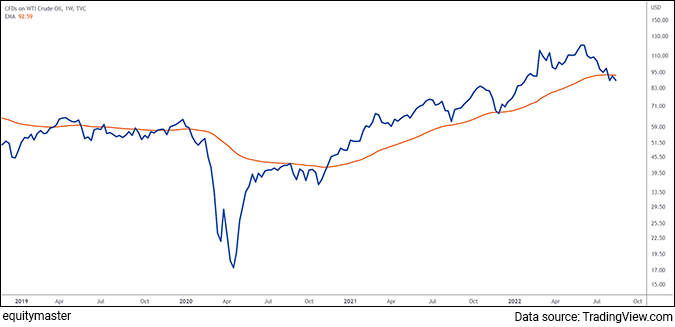
If I look at the third chart over here, this is the 50 weekly exponential moving average. If you look at the prices, they have closed convincingly now below the 50 exponential moving average week on week.
This is the first time we are witnessing since October-November 2022 that the prices have closed below the 50 exponential moving average on a weekly chart.

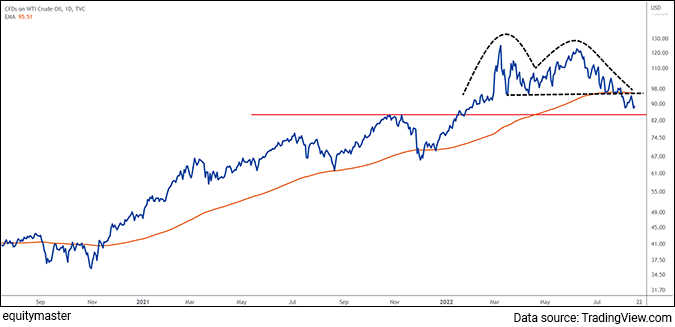
If I use a top down approach and move on to the daily scale over here so there are multiple setups onto the daily chart. If you look at the black line, the black double top structure, we saw a convincing breakdown below the neckline. The neckline was retested at US$ 96-97 and we saw it back on the downside journey on the crude oil.
Second, if I just look at the orange line, if you look at the moving average, again a 200 day exponential moving average, prices are convincingly trading below that long term average of 200 days.
Third, if I just look at the red line, if you look at the chart over here, it is acting as a support zone. It may, because the previous swing high, the resistance, may act as a support zone now, and I believe it is placed at around 84-84.5 dollar mark. So a close below US$ 83 mark would again confirm that the trend has changed.
So if you remember, a 45 degree trend line is placed at around 84-85 dollar mark. The red trend line on the daily chart is placed around 84-85 mark. So I believe once 83 is convincingly broken and a weekly close below US$ 83 mark on the Friday close, I believe we may retest the US$ 55-58 onto the downside which is the 45 degree trendline onto the lower level, on the weekly scale.
So keep a watch on crude oil. US$ 83 mark will play a key important role. Once below that, go short, and again, this is beneficial for global equity markets, where the crude oil prices are going down, which will boost equity market, which is trending very higher. We are approaching Nifty 18,000 mark now. So this may boost equity market and the US$83 mark on the crude oil, keep a watch.
Signing off, Brijesh Bhatia.
Warm regards,

Brijesh Bhatia
Research Analyst, Fast Profit Report
Equitymaster Agora Research Private Limited (Research Analyst)
Recent Articles
- Pyramiding PSU Bank Stocks September 22, 2023
- How to trade PSU banking stocks now.
- 5 Smallcap Stocks to Add to Your Watchlist Right Now September 12, 2023
- These smallcaps are looking good on the charts. Track them closely.
- Vodafone Idea - Can Idea Change Your Life? September 6, 2023
- What is the right way to trade Vodafone Idea?
- Repro Books Ltd: The Next Multibagger Penny Stock? August 28, 2023
- Is this the next big multibagger penny stock? Find out...


Equitymaster requests your view! Post a comment on "Goodbye US$ 100 Crude Oil". Click here!
Comments are moderated by Equitymaster, in accordance with the Terms of Use, and may not appear
on this article until they have been reviewed and deemed appropriate for posting.
In the meantime, you may want to share this article with your friends!