Are IT Stocks Bottoming Out?

The worst performing index this year has been the IT index. The meltdown in tech stocks has been the trigger for the fall in these stocks.
In this video, I'll use my charts to show you why these stocks could be bottoming out.
Watch the video and share my thoughts in the comments. I love hearing from you.
Has the IT index bottomed out? Welcome subscribers to the Fast Profits Daily. Myself, Brijesh Bhatia.
If you remember, a few months back, I have done a video on IT index saying that it is a toping information when it was trading somewhere around nearly 33,000-34,000 and we have seen it back towards 26,000 levels.
Don't Miss: Key Information for Long-term Investors
And today, I am saying, is forming the short term bottom. Again, I'm repeating. I'm not indicating that the long term top could be negated, but I think that the short term bottom can be in place and we may see a bounce or a reversal of around 10-12% into the IT index.

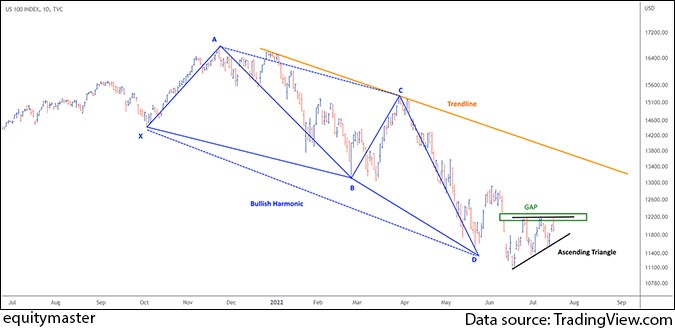
Let's start with the first chart or here, the NASDAQ, the US index, and it's been the highest weighted into the IT Index and the Nifty IT also follows in its footsteps. Sometime it may outperform, sometime it may underperform, but generally, the footsteps are same.
Index has been in a huge pressure. NASDAQ especially has been in huge pressure into the US, and IT have seen a 30% correction, nearly 30% correction in 2022. From the highs of somewhere around 39,500, we are back into the range of 26,000 on the IT index.
But if I look at the structure of the NASDAQ over here, there are multiple structures indicating that the reversal can be on the cards.
If you look at the orange and blue over here, the blue is the bullish harmonic called the bullish black swan. The reversal was somewhere there and it went around a few percentage down by around 3-4% down and we have seen a sign of reversal.
Second, if I look at the green line, the gap area is a minor resistance for the bulls to take out with the ascending triangle. The black one is the ascending triangle structure. So the gap area and ascending triangle could be first sign, once the breakout happens, it could the first sign that the reversal could happen and that is placed somewhere around 12,250.
Keep a buffer of a few points considering 12,300 being a confirmation of the short term bottom in place for NASDAQ, which could see and huge upside side.
Plus if you see the trendline over here, I believe once the ascending triangle and gap area is taken out, the NASDAQ might go higher to test the trendline, which is placed at around 13,350-13,400 levels on the upside.

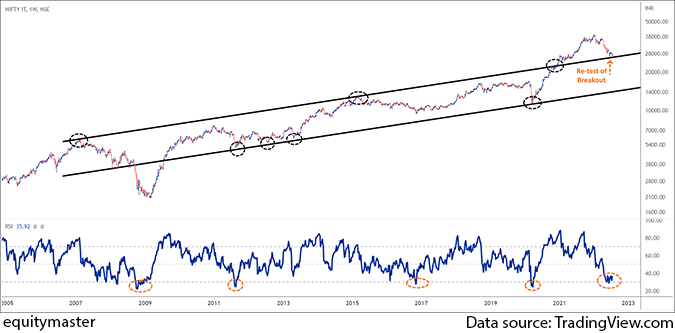
The second chart. If I just move to the Indian IT index chart, this is the weekly chart of the CNX IT or Nifty IT, and if we look at the rising channel, we saw a break out. The breakout has been re-tested if look at the orange marks over there.
The re-test of break out is indicating that the break out of rising channel is being re-tested right at 26,300 levels.
Second, if I just look at the broader trend right from 2009, it has been bullish because we are witnessing a higher high, higher low structure which is a sign of again, a bullish scenario.
If you look at in lower panel on your screen, the chart, the RSI is basically known as the strength of the momentum and that is placed into the oversold territory.
Since 2009, whenever it tests around 30 zone, which is generally know as oversold territory for RSI, and on a weekly scale, they generally form a reversal structure. Sometimes it may go to the new all-time high. Sometimes it may see a reversal structure and go into consideration.
This time, I'm expecting the reversal move of around 10-12% as I said. Till 39,500 is not crossed on a broader time frame, I believe this could be just a bounce and as a trader, 10-12% on the IT index could be a good move considering looking at TCS. It has been trending at below 3,000 levels. Infosys is trending around 1,400 levels. HCL Tech hitting the 52-week low. Wipro is trending around 200. I believe that the short covering rally could be on cards for the IT index looking at the weekly structure.

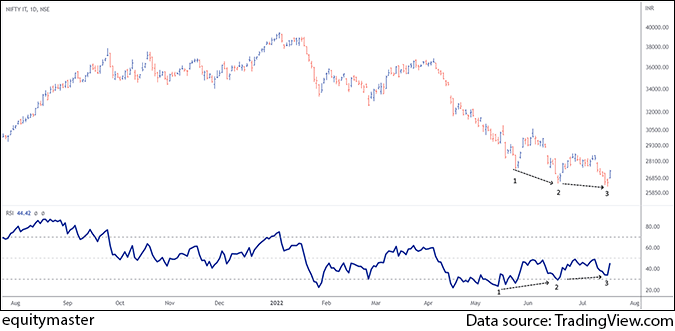
If I just look at the top down approach and move on to the daily chart which is again more convincing in support with the weekly scale over here.
We are witnessing triple bullish divergence or triple positive divergence on RSI. So if you look at the markings over here, 1, 2, and 3, the prices on the above chart, if you look at 1 to 2, the prices made a new low. 2 to 3, prices again made a new low. But if you look at the lower panel, which is the RSI, prices here are making the higher lows.
If you look at the structure over here, 1 to 2, the lows are higher. 2 to 3 the lows are higher. It is a sign of bullish divergence or positive reverence on daily scale as well.
So the weekly scale trending at a huge support zone, showing signs of positive momentum, NASDAQ showing signs of positive momentum, daily scale of Nifty IT Index showing the positive divergence, again indicating that the bulls may lose the momentum over here and we may see around 8-10% probably a 12% rally into the IT index or the NASDAQ.
Once the NASDAQ crosses 12,300, I believe the rally could be fast and furious for another 5-7% quick move on the NASDAQ, and we may see the upper trendline, which is 13,350-13,400 can be on cards for NASDAQ, which could again boost IT index on a positive side.
I'm repeating again. I'm just looking for the short term from a trader per se that the IT index could be the short term trade you should look at.
Signing off, Brijesh Bhatia.
Warm regards,

Brijesh Bhatia
Research Analyst, Fast Profit Report
Equitymaster Agora Research Private Limited (Research Analyst)
Recent Articles
- Pyramiding PSU Bank Stocks September 22, 2023
- How to trade PSU banking stocks now.
- 5 Smallcap Stocks to Add to Your Watchlist Right Now September 12, 2023
- These smallcaps are looking good on the charts. Track them closely.
- Vodafone Idea - Can Idea Change Your Life? September 6, 2023
- What is the right way to trade Vodafone Idea?
- Repro Books Ltd: The Next Multibagger Penny Stock? August 28, 2023
- Is this the next big multibagger penny stock? Find out...


Equitymaster requests your view! Post a comment on "Are IT Stocks Bottoming Out?". Click here!
Comments are moderated by Equitymaster, in accordance with the Terms of Use, and may not appear
on this article until they have been reviewed and deemed appropriate for posting.
In the meantime, you may want to share this article with your friends!