This is How You Should Trade Intraday

In my previous two videos, I discussed various charting time frames that you should use for trading and analysis.
We saw that a swing trader could use a daily timeframe for identifying stocks, then go on a higher time frame to confirm the view, and then go on a lower time frame to identify entries and exits.
Swing trading is quite simple.
However, the problem arises when you are day trading. When traders are successful with swing trading, they shift to day trading and that's when matters get complicated.
But it need not be that way.
In today's video, I'll show you how to trade the market intraday like a professional trader.
Let me know what you think about the video in the comments.
Hi, I'm Apurva Sheth and I welcome you to this latest edition of Fast Profits Daily, For the last two weeks, I have been talking about various kinds of time frames that one should use for trading and analysis.
So we saw that for a swing trader, one could use a daily timeframe for identifying stocks and trades in them and once you pick a stock, which seems to be a good bet for trading, then you can go on a higher degree time frame that is a weekly time frame and confirm your view.
If the view is confirmed, you can go on a lower degree time frame that is an intraday time frame to identify your entries and exits. So swing trading is quite simple.
However, the problem arises when you are day trading. So normally what people do when they are successful with their swing trading, they shift to day trading and that's when the matters get complicated. So when you move from a daily candle or a daily timeframe to a five minute time frame, that becomes a very difficult to trade because a five minute time frame acts very differently from a daily time frame.
So what I suggested is that a day trader could use a 15 minute time frame for identifying the trades and trading opportunities and when's he gets that stock that he is looking for which looks good, he can go on a higher degree time frame.
Now a higher degree time frame for intraday trading would be something which is close to 75 minute chart. I explained the reason why one should use the 70 minute chart because a 75 minute chart exactly divides a trading day which is from 9.15 to 3.30, into 5 equal sessions. So no other chart of a higher degree time frame. By no other chart I mean, the 60 minute child does not divide the day equally into equal sessions. So I prefer a 75 minutes over the 60 minutes or any other time frame.
Now, lot of viewers wrote that a lot of broking platforms do not allow to view 75 minute chart. So for them, I would suggest that you could go with 60 minute chart or, if your broking terminal allows, then you could use our 25 minute time frame, which exactly divides the 75 minute into three sessions. So you can go with 25, 15, and 5 kind of time frames.
So now, today we will see how one could practically use these kinds of time frames to identify trading opportunities, especially on an intraday basis.

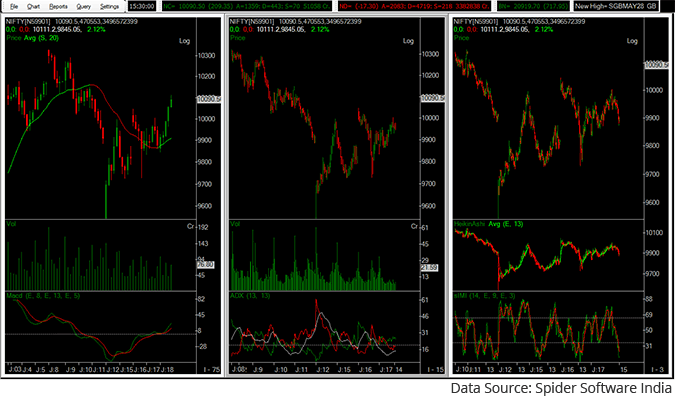
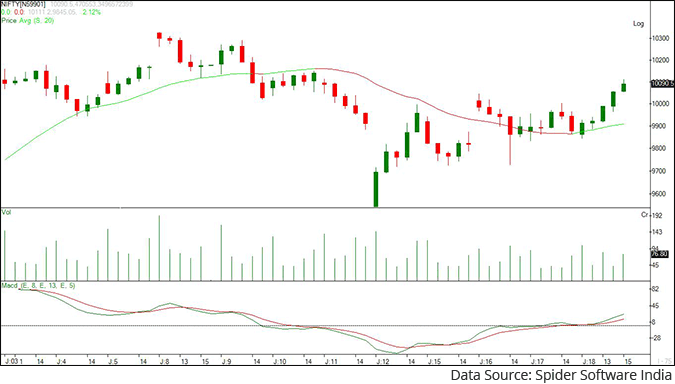
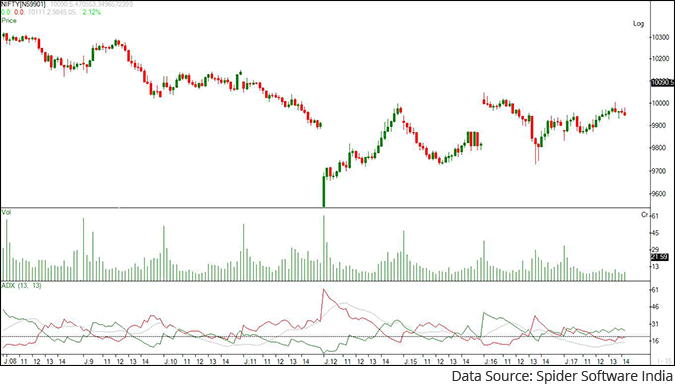
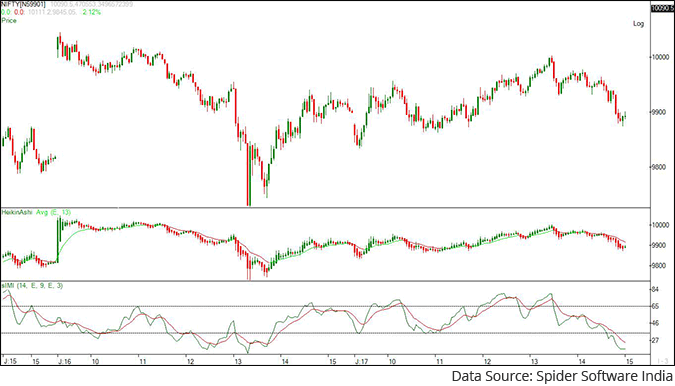
So now you can see my screen. I have all the three time frames that I spoke about. So here in the first panel. This is the 75 minute chart. The second panel is the 15 minute chart of the Nifty and the third panel is the same chart of the Nifty but on a 3 minute time frame.
So you can see how as you go on lower time frames, the zigzag nature or the up and down moves can get much more extreme. It would be difficult if you are trading a smaller degree time frame, a three minute time frame or a five minute time frame. So that is the reason why I prefer looking a higher degree time frame first and then only use a smaller degree time frame for picking entries and exits.
So now today we will also see what kind of indicators we could use. Now, before I go into these indicators, I would like to tell you that there is no right or wrong way to use specific indicators. That's absolutely dependent on the trader's choice of indicators. There are 250 indicators and many more that a trader could develop on his own. So it is completely on his own discretion what kind of indicators to use.

I would recommend just one example what indicators one could use. So here is the 75 minute chart. Here I have plotted a simple 20 day moving average, which helps me determining the trade and I also used the moving average convergence-divergence.
Now this is simply an indicator which plots the difference between two moving averages. So if the shorter term moving average is above the longer term moving average, then the indicator will be above zero and it indicates that the trend is positive. The short term trend is positive and if this indicator is below zero, then it indicates that the trend is negative.
So on the 75 minute chart, I use moving average or MACD which most traders call to determine the trend. Now, once you have determined the trend, so basically, whenever I study charts on an intraday basis, I use only 75 minute charts and in all my studies, all the trend lines I use which are on this 75 minute chart.

Now, once the trend is determined, whether up, down or sideways, I use 15 minute chart and here what I use is the ADX. Now the ADX is an indicator which tells you the strength of the trend. It does not tell you weather the market is moving up or down, but it tells you whether there is strength in the market or not.
So the white line that you can see out here if it is trading above 20 it would tell there is strength in the market of there is strength in the ongoing trend and if it is trading below 20, then it would suggest that there is a limited trend and if there is this limited trend in the market, then one should avoid trading such kind of stocks or market.
So on a 15 minute time frame, I use an ADX which will help to determine whether there is strength in the trend. So there is a saying that never long or short a dull market. So basically an ADX helps you determine whether the market is buoyant or it is dull.

Now let's move on a three minute time frame. The indicators that I use on a 3 minute time frame is RSI. Now RSI is a bounded oscillator which tells you if the market is over bought or over sold. So here in the bottom most panel is the RSI.
So the best entry from a RSI perspective would be when the RSI is at its lows. The RSI ranges between 0 and 100. When it's trading close to 20 it's known as oversold levels and when it's trading near or above 80, it's known as over bought level.
So if you want to taken entry from a long perspective, then when the RSI is the trading closer towards over sold levels that would be a good time to enter and if you want to sell, then the right time frame will be when the RSI is the trading near it's over bought levels.
Apart from the RSI, I also use the Heikin-Ashi candle which you can see out here. Now it is a simple version of the same candlestick pattern, but it filters prices is such a way that you will not see gaps in the chats. So as you can see out here, there was a gap when the Nifty opened but on the Heikin-Ashi candle there wasn't any gap. So it helps you determine the trend much more clearly.
You can see that the Heikin-Ashi candle is also trading in the red when the markets are trending lower. So it helps to demine the trend on a shorter time scale as well. So that how you can use these 3 time frames for analysis along with the indicators.
I hope this helps you with your analysis and trading, and this will help you become a better trader. I hope you enjoyed watching this video and in case you did then please like it, share it subscribe to our channel and also share this video with your friends who may be struggling with day trading. I'm sure this will help them improve their trading.
So that's all from me for today. Thanks a lot and have a nice day.
Stay safe and have a great weekend!
Warm regards,

Apurva Sheth
Senior Research Analyst, Fast Profits Report
Equitymaster Agora Research Private Limited (Research Analyst)
Recent Articles
- Pyramiding PSU Bank Stocks September 22, 2023
- How to trade PSU banking stocks now.
- 5 Smallcap Stocks to Add to Your Watchlist Right Now September 12, 2023
- These smallcaps are looking good on the charts. Track them closely.
- Vodafone Idea - Can Idea Change Your Life? September 6, 2023
- What is the right way to trade Vodafone Idea?
- Repro Books Ltd: The Next Multibagger Penny Stock? August 28, 2023
- Is this the next big multibagger penny stock? Find out...
Equitymaster requests your view! Post a comment on "This is How You Should Trade Intraday". Click here!
1 Responses to "This is How You Should Trade Intraday"


Ashok Bartakke
Jun 21, 2020I am interestedinintraday tradepl.guide