My View on the Stock Market

Today, I am going to talk about the stock market after a fairly long time.
In the past I've advocated caution. Sometimes I've even said that the markets run a risk of falling.
But the markets have continued to rally.
In this video, I'll show you with the help of four charts, why I maintain my cautious stand on the stock market.
Hopefully I will be able to explain to you why I've taken this stand and why I believe it's important to you as a trader.
Watch the video and let me know your thoughts. I love to her from you.
Hello, friends. This is Vijay Bhambwani and in this video, I am going to talk about the stock market after a fairly, fairly long time.
The markets are continuing on their upward journey, defying gravity and defying all odds. In the past of advocated caution, sometimes even saying that the markets run a risk of falling but the markets have continued to rally.
So off late, I have started recommending ETFs which are up broad bouquet or a basket of stocks exactly in the same proportion as they are constituting their respective indices as a measure to capitalise from the rally.
Don't Miss: Key Information for Long-term Investors
Since I'm a trader who believes in a system based trading and using statistical models to trade, I'm going to show you some things which are based on these systems and tell you why I am advocating what I'm advocating.
Please understand are not outright bearish on the market but I am extremely cautious on the market There's a difference. When you're conscious, you proceed to do what you are doing but maybe you do less of it, and you do it extremely carefully, looking over your shoulder all the time to see if adversity is going to strike.
But when you're outright bearish on something, you do not do it at all. So I'm not telling you do not trade stocks. All I am telling you is to do it consciously. Big difference. Big difference.
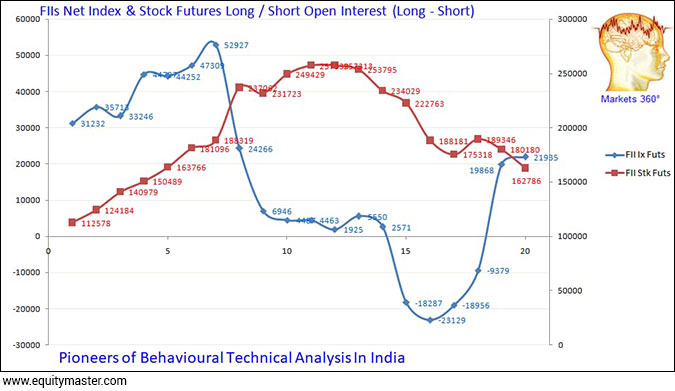
Now coming up on your screen are a couple of graphics. The first one is the open interest of the FIIs or the foreign investment institutions.

The red line indicates stock futures and the blue line indicates index futures. Now take a look at what the FIIs have done. Their index future exposure is approximately 60% lower from the April peaks, whereas the stock futures exposure is down by approximately a third from its recent peaks. Which means that the FIIs are cutting their positions lower.
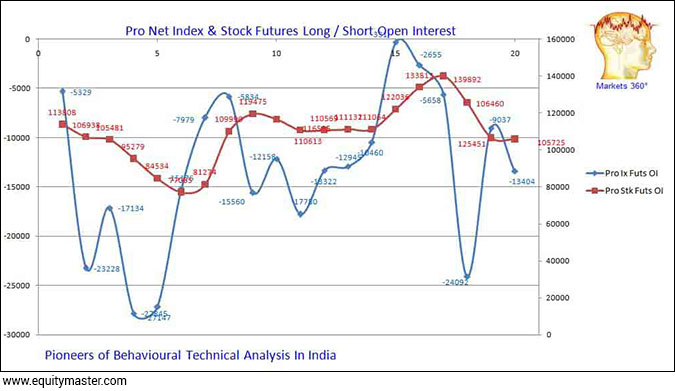
Second, the professionals and the proprietary trades of brokers.

Here, the blue line is the index, whereas the red line is the individual stocks futures. The professionals and the proprietary trades of brokers remain in the net short in the index since the last five sessions.
Just in case you're wondering, what five sessions, I'm recording this video on Thursday, the 20th of May, which will, of course, be released on 21st of May which is Friday after editing and post production process and the data that I am showing you is as of end of the day trading session on Wednesday evening.
So as on Wednesday evening, since the last five sessions, the professionals and the proprietary trades of brokers are showing net short on the indices since the last five sessions.
Stock futures exposure, on the other hand, is down a minimum 25% of their recent peaks, which are, which is barely four sessions ago.
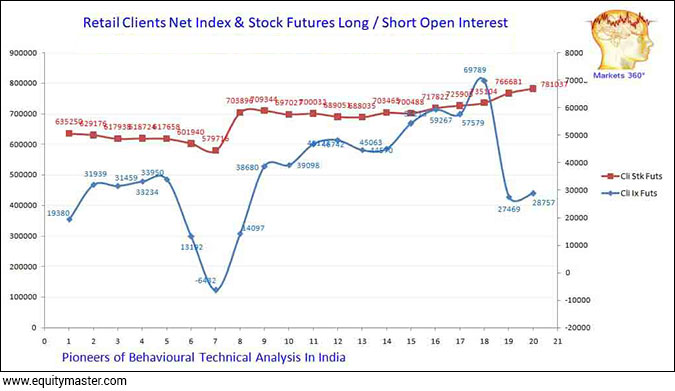
Now take a look at the third charge, which is the retail individual traders like you and me.

Now they continue to ramp up their stock and futures exposure, which is denoted by the red line, whereas they've cut short their exposure on the index futures very sharply on Tuesday, which is the 18th of May but net long positions on the index exist for even the retail traders.
Now, if you were to take the numbers as consolidated numbers, you will see that all the selling and all the reduction in the positions of both the FIIs and the professional/prop trades of the brokers is being absorbed by the retail traders.
Which means that the market is now completely, completely dependent on retail buying to propel prices higher.
Now, veteran traders who've gone through phases like the post Harshad Mehta decline, the dot com bust of 2000, the global financial crisis of 2008, the Southeast Asian currency crisis of 1997-1998, they would know one happens when the market is completely skewed in favour of the exposure of any one category of people, in this case it is the retail guys, many of them who are newbies or new blood which has come to the market, many of them are even millennials, which means they are never seen a bear market, how fast the market can decline.
So what is basically happening is that there is an overhang of belief that you buy in the morning and by afternoon you can get away with a profit, if not on the same day, then maybe on the next day you will be able to get out with a profit and guess what, on many days, this is happening but off late something else has happened.
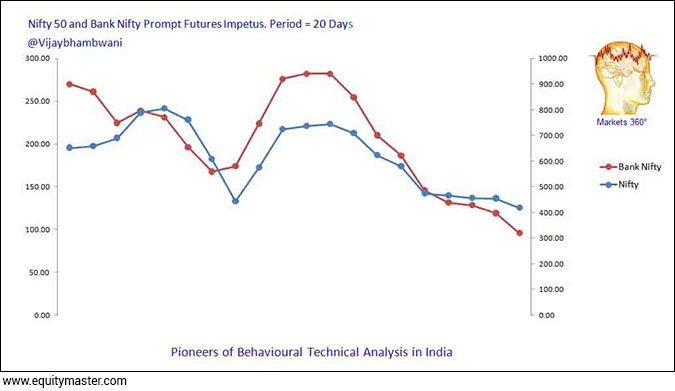
Now, before we reach there, let me show you the fourth and final chart on your screen now, which is the impetus chart. Impetus is nothing but statistical velocity or the momentum. It's like the acceleration in the change in price and I have shown you the impetus of the Nifty and the Bank Nifty.

Even though recently the indices have gone up, you're basically saying that the impetus is falling. Now, why is this happening? There's a simple reason and I have told you many a times in my recent videos that nothing happens, nothing at all in the financial markets without a reason and since we are talking about financial markets, the reason itself is financial in nature.
So why is the sympathy impetus charge? Showing that the velocity is easing?
For the simple reason that number one, the ranges of the indices, have contracted a little and, more importantly, number two, the indices on the days that they are rising are opening with a gap up most of the times and then meandering around at the opening levels, a little bit of a rally intraday, but not enough to leave something for the MOC or market on close, somebody who enters the trade at open, waits till the closing bell to square up the transaction and never takes an overnight position.
So if you're that kind of an intraday trader, off late, you will realise that if you are buying on the open and selling at close, net-net, you might see that the index has made triple digit gains but what's coming into your hands is low double digits, and after brokerage and execution costs, it might actually be disappointing.
Now, after a gap up openings, when the indices are treading water, the other thing that happens is that options premia tends to basically erode on a day on day basis.
Now what is happening is that option writers are basically writing calls and writing puts and keeping the markets constrained within those levels, and at the end of the day, you'll see that options premia on both sides is eroding rapidly. Typically, the weekly options. That's where majority of the exposure lies.
Is it possible, therefore, to modify your trades and therefore take overnight exposure because day on day, the markets are rising? The answer is yes and no.
Many eight days out of ten, maybe three days out of four, you will make money by going long and carrying positions overnight and squaring it on the next day but you know what? Along comes a few days when jitters happen in the markets, when even the most favoured sectors recently metals were in the limelight. They continue to remain in the limelight. There are bullish reports of all and sundry in the mainstream and social media.
In day before yesterday's video, I talked to you about how falling prices of lumber have resulted in prices of base metals falling and then it had a cascading effect on the stocks that are cyclicals or metal stocks like Tata Steel and Hindalco.
Now this is something which we call the domino effect. This can even be called the butterfly effect when the flapping of wings of a butterfly, which is not expected to cause major disruptions, actually winds up creating a storm of fury.
Now lumber, which is not traded in the commodity exchanges in India but in the US when lumber fell, creates unwinding in metals that creates an unwinding in metal stocks here. That's worrying.
So if you were to take an overnight position as longs in Tata Steel and Hindalco, as a matter of fact at the opening levels on Thursday, when I'm recording this video, both of these stocks are approximately 3.5 to 4% down with a gap.
Ditto for another favoured sector, automobiles. Ask somebody who was long at Tata Motors at 330-335 when the stock is now trading more towards 312-313 multiply backed by the market lot and you see what kind of bone crunching losses that are occurring.
Which is why I repeat again, I am not an outright bear at the equity markets because I have not seen a full U-turn and reversal in the markets but I will admit that my trades are fewer and far between on equities as compared to commodities, which is why the Weekly Cash Alert subscribers are likely to receive somewhat more trades when the Vertical Trade Alert.
It's not that there will be no trades and Vertical Trade Alert at all. Far from it. This is not going the way of FIA or Fast Income Alerts, but you need to be extremely careful out there. You just can't go with the herd mentality and go with the flow because, as the old saying goes, 10,000 Frenchmen can and do go wrong.
There are times when the markets are skewed, like the ones they are now. The only thing that's propping up the market is the retail segment, and they are neither strong nor are they savvy. The first thing that will happen is that over leveraged as the retail, especially the millennials and the newbie traders are, they may not be able to sustain the mark to market payments of the stocks that they have bought and are falling.
They may be forced to exit by the margin calls themselves and do remember on the count of margin calls, first of June is not very far away, probably 10 days away. Your peak margin system will restrict your stacking or intraday exposure limits, which is currently at 2%, fallen from 4% in November, it's currently at 2%, from first of June is going to go to 1.33 times or 133%.
So traded volumes are going to fall even further. The bid and offers spreads will become even more wider. Getting an entry will be relatively easier but getting an exit might just become a little more laborious and you might have to surrender some amount of your trading profits to be able to exit that stock, because the gap between the bid in the offers or the buyers and the sellers might just be a little wider and, of course, the margins required by the exchanges to continue to trade will go up. So it will become even more capital intensive.
Friends, even at the risk of sounding and becoming a little more unpopular than I already am, on the equities front, I consider it as my duty to update you about what to expect from the equity markets.
Continue to trade by all means. Nothing should stop, but the amount of care that you exercise and the amount of diligence that you exercise must go significantly higher, even many times higher than the amount of care that you're putting in even now.
It's your money. We cannot afford to sacrifice your capital. On this sombre note, I'll bid goodbye to you in this video not before reminding you to click like on this video if you liked what you saw.
Subscribe to my YouTube channel if you haven't already done so. Click on the bell icon to receive instant alerts about fresh videos being put up out there and in the comments section, feel free to send me anything, love, hate, negative, positive feedback. I welcome everything with open arms.
Help me reach out to fellow like-minded traders by referring my video to your family and friends. I wish you have a very profitable day today. Vijay Bhambwani signing off for now. Thank you for your patience in watching my video. Take care. Bye.
Warm regards,

Vijay L Bhambwani
Editor, Fast Profits Daily
Equitymaster Agora Research Private Limited (Research Analyst
Recent Articles
- Pyramiding PSU Bank Stocks September 22, 2023
- How to trade PSU banking stocks now.
- 5 Smallcap Stocks to Add to Your Watchlist Right Now September 12, 2023
- These smallcaps are looking good on the charts. Track them closely.
- Vodafone Idea - Can Idea Change Your Life? September 6, 2023
- What is the right way to trade Vodafone Idea?
- Repro Books Ltd: The Next Multibagger Penny Stock? August 28, 2023
- Is this the next big multibagger penny stock? Find out...
Equitymaster requests your view! Post a comment on "My View on the Stock Market". Click here!
3 Responses to "My View on the Stock Market"
Hardik
May 19, 2021Request to share your views on other precious metal Platinum, Palladium, Rhodium.
Nipan Bansal
May 19, 2021Dear Mr.Bhambwani
Greetings of the day
I have been an ardent fan of your research reports & your updates for about last 2 years now, since the time I have subscribed with equitymaster. Though I bought massively into Gold ETF's (Rs.1.60 Crores) at their peak last year around Rs.50000.00 levels (thereby having seen gold slide subsequently), but I have been holding on just because I have so much faith in your reasoning, logic and research and now am seeing gold return to those levels slowly and gradually
Thanks for your constant updates, please keep them coming
Regards
CA.Nipan Bansal
Ludhiana


Premkumar R
May 20, 2021Interesting information about lumbar and crude oil palm.