Capital Goods: The Big Bull of May

The month of May started on a bearish note which prolonged for 3 weeks before the bulls countered strongly during the F&O expiry week reclaiming 15,000 on the Nifty.
Metals (+21%) and pharma (+10%) lead the April series while realty (-7.5%) and PSU (-5%) were laggards.
The seasonality analysis of May for last 25 years has given an average return of 0.72% with 12 bullish years and 13 bearish.
So which sector will lead the way in May 2021?
Nifty: The Gaps Saga
Nifty has underperformed against global and EM indices during April 2021 on the back of rising Covid-19 cases and lockdowns in India.
The multiple indecisive candlestick pattern on weekly chart during rangebound markets seems to be ending as trending momentum is likely to resume.
Nifty Weekly Chart

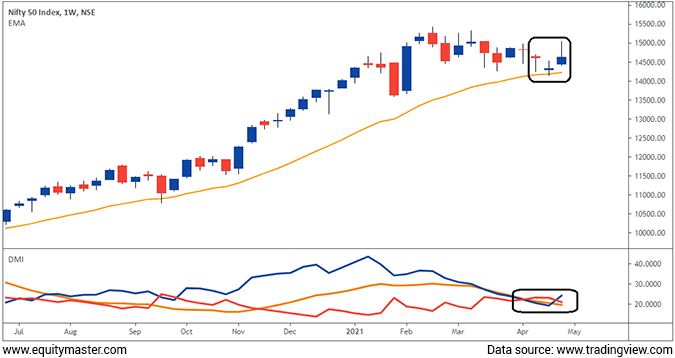
On the weekly chart, the morning star candlestick pattern is visible on chart which is bullish in nature.
This candlestick pattern is formed using three candles. When it forms on a weekly scale, a short-term bottom formation is in place.
This bullish reversal candlestick pattern is formed at 21 EMA (Exponential Moving Average) and is placed at 14,253.
--- Advertisement ---
Key Information for Long-term Investors
If you're an investor looking to buy stocks for a long term, then I believe this information could be useful to you.
Our co-head of research, Rahul Shah, has uncovered a potential big opportunity.
He believes this opportunity could span several years... perhaps even decades... and it could lead to potential wealth creation on a scale we've probably never seen before.
Every Serious Investor Needs to See This
----------------------------------------
Average Directional Index (ADX) on the lower panel of chart signals a bullish scenario as the positive Directional Index (+DI) crossed above the negative Direction Index (-DI) and the Average Direction Index.
The top-down approach on the Nifty chart from weekly to daily, strengthens the bullish scenario.
Nifty Daily Chart

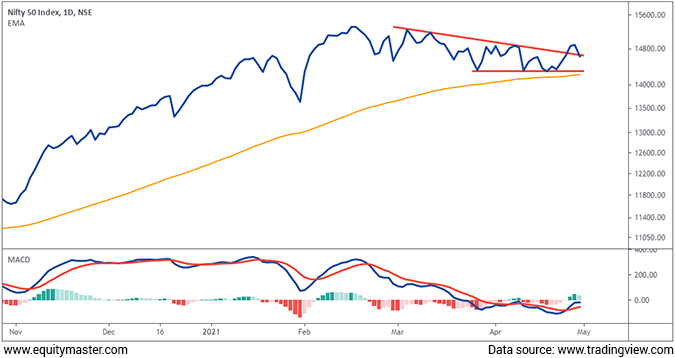
In the last week, during the bullish momentum from 14,500 to 15,000 levels, the index broke out of the descending triangle pattern and the last hour sell-off retested the breakout level.
The recent low was formed at the 100 EMA, The positive crossover of averages on the MACD (Moving Average Convergence Divergence) strengthens the bullish scenario.
With the recent low of 14,151 as a trend change level, we expect the index to head towards 16,000 in the coming months.
BSE Capital Goods Index - The Big Bull of May
BSE Capital Goods Index has underperformed against the Sensex for the last 6 weeks. We expect an underperformance to end soon.
Weekly Chart

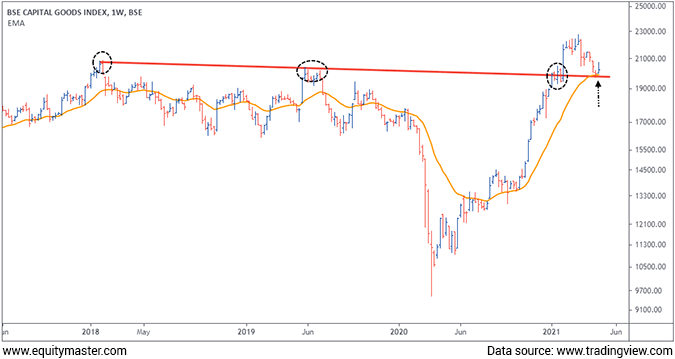
The weekly chart of the capital goods index has broken out of a multi-year trendline connected from the high of 2018 and 2019 in the start of 2021 and hit the high of 22,775.
But in the recent retracement, it has re-tested the breakout level.
The doji candlestick pattern formed in the week ended 23 April 2021 and confirmed the reversal by forming bullish candlestick last week.
The reversal structure is formed at 21 WEMA supporting the bullish scenario.
Daily Chart

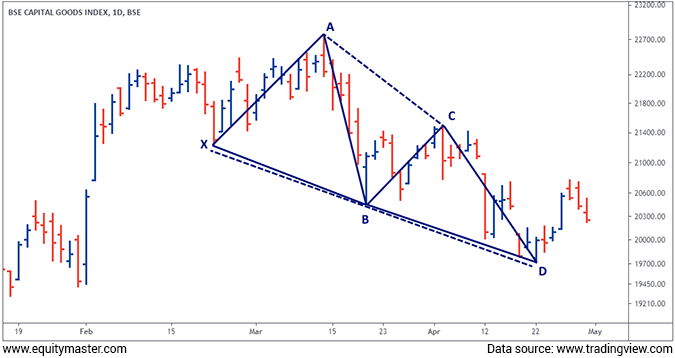
With the weekly chart indicating a breakout and retest, the bullish harmonic pattern is formed on daily chart too.
The bullish black swan harmonic pattern is visible and the reversal from the perfect Fibonacci level confirms the reversal.
StockSelect: Get Instant Access to Our Blue-chip Stock Recommendations
Details of our SEBI Research Analyst registration are mentioned on our website - www.equitymaster.comThe weekly and daily chart confirms the reversal. Capital goods stocks can be the leaders in the month of May.
Conclusion
The breakout of descending triangle at 14,600 on the daily chart as well as the morning star bullish candlestick on the weekly chart, indicates the bulls are in a strong position on D-street.
The Nifty is heading to 16,000 as indicated by the ADX as long as the recent low of 14,151 holds.
Capital Goods Index is likely to be the leader in the month of May and traders shouldn't miss this money making opportunity.
Warm regards,

Brijesh Bhatia
Research Analyst, Fast Profit Report
Equitymaster Agora Research Private Limited (Research Analyst)
Recent Articles
- Pyramiding PSU Bank Stocks September 22, 2023
- How to trade PSU banking stocks now.
- 5 Smallcap Stocks to Add to Your Watchlist Right Now September 12, 2023
- These smallcaps are looking good on the charts. Track them closely.
- Vodafone Idea - Can Idea Change Your Life? September 6, 2023
- What is the right way to trade Vodafone Idea?
- Repro Books Ltd: The Next Multibagger Penny Stock? August 28, 2023
- Is this the next big multibagger penny stock? Find out...
Equitymaster requests your view! Post a comment on "Capital Goods: The Big Bull of May". Click here!
1 Responses to "Capital Goods: The Big Bull of May"


Mandyam Rangaraj
May 3, 2021I wish Mr Vijay a speedy recovery