Nifty @ 16,000

The Week Gone By
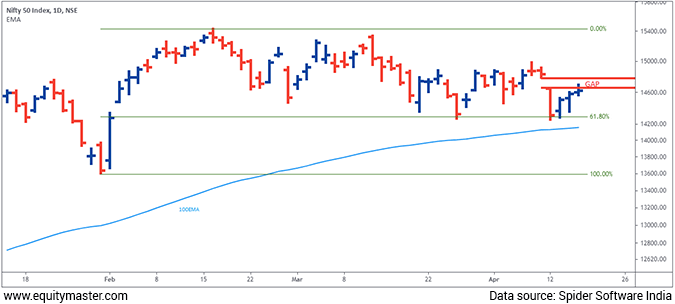
The bears started with gap-down opening on Monday taking the Nifty all the way to 14,248.
The index bounced back strongly indicating a bear trap.
Most of sectorial indices witnessed profit booking while pharma was the only sector in the green this week gaining 1.84%.
Nifty reclaimed 14,600 levels to end at 14,617.85 but reversal have been seen from crucial levels.
The bulls need more power to confirm the bullish setup.
The Week Ahead: Nifty Reversal from Crucial Support
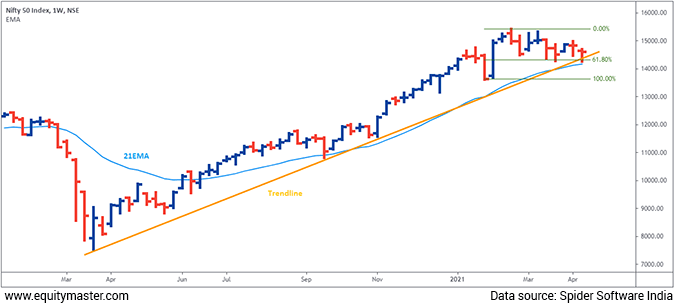
The truncated week witnessed participation from bulls and bears. Like the previous week's candlestick, this week too, the index formed a doji candlestick pattern.
Nifty Weekly Chart

Doji candlesticks are formed when bulls and bears fight for the trend. An indecisive price action results in an end where it opened. They are also known as reversal candlestick patterns.
On weekly chart, the doji has formed right at the golden ratio of 61.80% Fibonacci retracement from 13,634 to 15,431, at the 14,305 level.
--- Advertisement ---
Key Information for Long-term Investors
If you're an investor looking to buy stocks for a long term, then I believe this information could be useful to you.
Our co-head of research, Rahul Shah, has uncovered a potential big opportunity.
He believes this opportunity could span several years... perhaps even decades... and it could lead to potential wealth creation on a scale we've probably never seen before.
Every Serious Investor Needs to See This
----------------------------------------
Adding fuel for the bulls, it is supported by the 21 WEMA (Weekly Exponential Moving Average) which is placed at 14,171.
But the bulls need to cross 14,800 on the Nifty to confirm the reversal.
Nifty Daily Chart

The gap area of 14,652-14,785 will be major hurdle for bulls to cross i.e. for the bullish momentum to prolong.
US equity indices are trading at all-time highs and other global indices are trending bullish too. This can help the bulls cross the hurdle.
The move above 14,800 opens the door to 16,100 which is near 161.80% from 15,431 to 14,248.
Financial Services Index: An Underdog
This sector is the lifeline of the economy. Yet the Financial Service Index (FSI) has been an underperformer against Nifty since mid-February 2021.
In the last couple of days, we are witnessing outperformance from banking and financial service indices.
As per risk to reward structure, the FSI can be considered as best investment opportunity.
Nifty Financial Services Index Weekly Chart

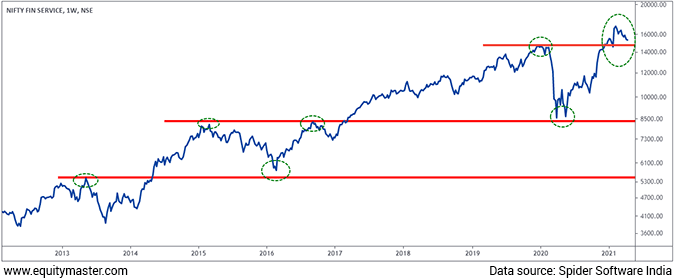
The weekly chart above is at the retest of the breakout at horizontal line.
Historically this is the trend in FSI as it retests it's previous all-time high and resumes the northwards journey.
The primary trend is bullish and as an investor, the dips should be an opportunity to accumulate. To confirm, the top-down approach from weekly to daily chart strengthens our view.
Nifty Financial Services Index Daily Chart

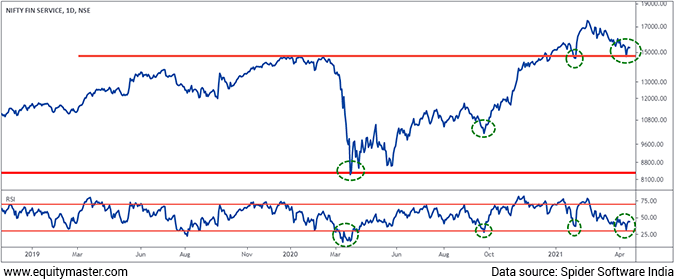
The weekly chart indicated an excellent buying opportunity. If we look at the daily chart above, the bulls dominate.
The slope of price has reversed taking support at demand zone. When we analyse the strength of the trend, its strong.
When we compare price action with the RSI (Relative Strength Index), it's at a bargain buying level.
When the RSI tests the oversold level of 30, the index tends to reverse and trends bullish. Similarly, if we look at the index now, it's at the demand zone and the RSI has turned from the oversold zone signalling a buy trade.
StockSelect: Get Instant Access to Our Blue-chip Stock Recommendations
Details of our SEBI Research Analyst registration are mentioned on our website - www.equitymaster.comConclusion
Nifty has reversed from multiple support zones of rising trendline, 21 WEMA and 61.80% Fibonacci retracement level.
The hurdle of gap area at 14,652-14,785 need to be cross by the bulls in the coming weeks to confirm the bullish trend and catch-up with global equity indices.
Financial Services Index has been underperforming Nifty for last couple of months, but we believe it is at an excellent bargain buying levels. Investors must focus on stocks from this sector.
Warm regards,

Brijesh Bhatia
Research Analyst, Fast Profit Report
Equitymaster Agora Research Private Limited (Research Analyst)
Recent Articles
- Pyramiding PSU Bank Stocks September 22, 2023
- How to trade PSU banking stocks now.
- 5 Smallcap Stocks to Add to Your Watchlist Right Now September 12, 2023
- These smallcaps are looking good on the charts. Track them closely.
- Vodafone Idea - Can Idea Change Your Life? September 6, 2023
- What is the right way to trade Vodafone Idea?
- Repro Books Ltd: The Next Multibagger Penny Stock? August 28, 2023
- Is this the next big multibagger penny stock? Find out...
Equitymaster requests your view! Post a comment on "Nifty @ 16,000". Click here!
3 Responses to "Nifty @ 16,000"
Pankaj Agarwal
Apr 16, 2021Hi Vijay
Great fan and a blind follower of yours.
Watching/reading all your daily Videos/Letters and have learnt a lot till date & this process continues.
Thanx for revealing this "BUBBLE TRUTH/TRIGGER/WARNING". 100% agreed.
whenever this happens we should be ready and in order to be ready for this, I request you to advice me few Derivative Stocks for SHORT SELLING, please.
THANKS
PANKAJ


Vijay Bhambwani
Apr 21, 2021Thanks Mr Agarwal. Please standby for trade alerts.