India's Third Giant Leap
This Could be One of the Biggest Opportunities for Investors
- Home
- Views On News
- Sep 5, 2023 - Wipro Share Price: Is the Downtrend Finally Over?
Wipro Share Price: Is the Downtrend Finally Over?
Indian IT stocks, especially large-caps, have faced challenges in the last few quarters.
Wipro, one of top IT companies in India, has not been an exception to this trend, experiencing a significant correction of over 50% in the 18-month period from October 2021 to April 2023.
However, recent price action and technical indicators suggest a potential reversal.
This article analyses the potential bottoming pattern in Wipro's stock using the Wyckoff theory's concept of accumulation and the impact of the 200-Day Exponential Moving Average (200DEMA).
Accumulation Zone of Wyckoff Theory
The Wyckoff theory is a powerful tool in technical analysis for identifying potential reversals in stock prices.
It includes the concept of an accumulation phase, which is crucial for spotting a potential bottom.
The accumulation phase typically consists of several stages.
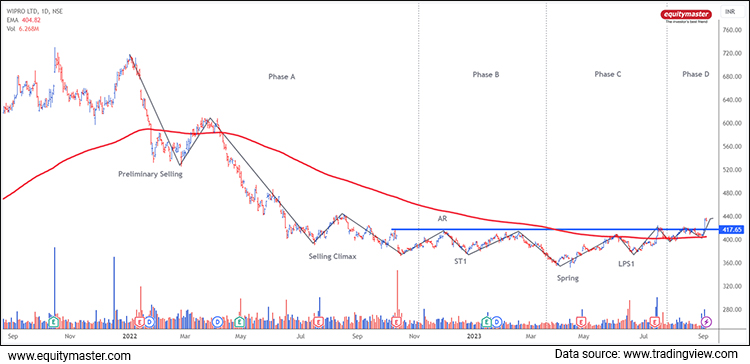
Daily Price Chart

- Selling Climax: A sharp decline in price with high volume, indicating panic selling.
- Automatic Rally (AR): A short-term recovery in prices after the selling climax.
- Secondary Test (ST): Prices return to test the previous low, but with reduced volume, suggesting waning selling pressure.
- Spring: A significant event, where prices briefly dip below the previous low but quickly recover.
This signals that smart money (institutions or experienced traders) is accumulating shares, leading to a potential reversal.
Wipro's Potential Spring
In April 2023, Wipro's stock reversed from its low point of Rs 366, with volumes indicating a resurgence in bullish sentiment.
This reversal is reminiscent of a "spring" in Wyckoff's theory, where prices dip below a critical support level (previous low) and quickly rebound.
Since the spring, every rise in Wipro share price has been accompanied by an increase in trading volumes, signaling a potential shift towards a bullish scenario.
Entry into Phase D
The stock has recently broken above a resistance zone highlighted by a blue horizontal trendline.
This breakout is significant as it marks the entry into Phase D of the accumulation zone according to Wyckoff's theory.
Phase D is typically associated with the beginning of a bullish trend, further reinforcing the potential for a price reversal.
The Impact of 200DEMA
The bulls are in the game as the stock is convincingly trading above its 200DEMA. The 200DEMA is a long-term trend-following indicator that smoothens out price fluctuations over 200 trading days.
The stock price trading above the 200DEMA is considered a sign of a bullish trend.
Conclusion
While past performance is not indicative of future results, the technical analysis of the stock suggests that it may be forming a bottoming pattern on the charts.
The combination of Wyckoff's theory accumulation phase, the spring-like price action in April 2023, and trading above the 200DEMA indicate the potential for a bullish trend reversal.
However, investors should exercise caution, conduct thorough research, and consider their risk tolerance before making investment decisions in any stock.
The stock market is subject to various factors that can influence prices, and technical analysis is just one tool to assist in decision-making.
Investment in securities market are subject to market risks. Read all the related documents carefully before investing
Out Now
3 High Conviction Stocks
Chosen by Rahul Shah, Tanushree Banerjee and Richa Agarwal
Report Available
Details of our SEBI Research Analyst registration are mentioned on our website - www.equitymaster.comDisclaimer: This article is for information purposes only. It is not a stock recommendation and should not be treated as such. Learn more about our recommendation services here...

Brijesh Bhatia Research Analyst and expert chartist, is the editor of Alpha Wave Profits. Fully committed to his craft, Brijesh has mastered the art of making money by trading using technical analysis. Brijesh has an MBA from ICFAI and 16 years of experience in India's financial markets. He began his career on Dalal Street as commodities dealer and it wasn't long before he developed his own unique trading system. Brijesh worked on his trading system until it could be expected to deliver 5 units of return for every unit of risk.


Equitymaster requests your view! Post a comment on "Wipro Share Price: Is the Downtrend Finally Over?". Click here!
Comments are moderated by Equitymaster, in accordance with the Terms of Use, and may not appear
on this article until they have been reviewed and deemed appropriate for posting.
In the meantime, you may want to share this article with your friends!