India's Third Giant Leap
This Could be One of the Biggest Opportunities for Investors
- Home
- Views On News
- Aug 3, 2022 - Why the Nifty can Still go the Distance
Why the Nifty can Still go the Distance
Social media platforms, especially Twitter, was full of tweets on a overbought market yesterday.
The momentum took a pause and the Relative Strength Indicator (RSI), an oscillator to measure strength, crossed the 75-mark. This is an overbought zone on the daily chart.
Yesterday, Indian share markets closed on a flat note but still managed to end in the green for the fifth consecutive day.
That brings us to this question...
Is an overbought RSI a sign of a reversal?
If you believe so, I highly recommend you watch this video.
In the video, I have highlighted the rally even when RSI moves into an overbought zone.
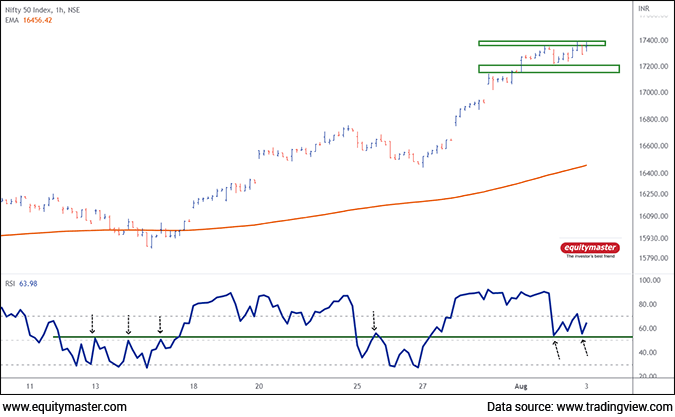
On short-term charts, the RSI is hovering at 60 which is a bullish entry if it is in sync with the daily chart.
Clearly , the bulls are having a gala time.
Nifty Daily Chart

Hang on bulls. Take a breather
The Nifty 50 index is trading in the range of 17,200-17,400 since yesterday. The bulls are accumulating energy to go the distance towards 17,700.
Traders should look for longs on the break above 17,415.
As I write this, the SGX Nifty live index is down 37 points at around 17,290 levels.
Meanwhile, the Nifty is trading at around 17,265, down 80 points. Cipla and Tech Mahindra are the top gainers today. While Coal India and Kotak Bank are the laggards.
If you're interested in being part of my charting journey as I share how to create wealth from the profitable trade setups, join my telegram channel - Fast Profits Daily. You'll get access to the best trading ideas in the stock market.
To know more about how the Nifty and Bank Nifty index are performing, please see the NSE Nifty Live Chart and NSE Bank Nifty long term chart.
Disclaimer: This article is for information purposes only. It is not a stock recommendation and should not be treated as such. Learn more about our recommendation services here...

Brijesh Bhatia Research Analyst and expert chartist, is the editor of Alpha Wave Profits. Fully committed to his craft, Brijesh has mastered the art of making money by trading using technical analysis. Brijesh has an MBA from ICFAI and 16 years of experience in India's financial markets. He began his career on Dalal Street as commodities dealer and it wasn't long before he developed his own unique trading system. Brijesh worked on his trading system until it could be expected to deliver 5 units of return for every unit of risk.


Equitymaster requests your view! Post a comment on "Why the Nifty can Still go the Distance". Click here!
Comments are moderated by Equitymaster, in accordance with the Terms of Use, and may not appear
on this article until they have been reviewed and deemed appropriate for posting.
In the meantime, you may want to share this article with your friends!