India's Third Giant Leap
This Could be One of the Biggest Opportunities for Investors
- Home
- Views On News
- Jul 19, 2023 - Infosys: Rising from the Ashes?
Infosys: Rising from the Ashes?
The share price of Infosys saw a gap down move in April 2023. Since then, the stock has underperformed both the Nifty50 and the Nifty IT index.
This caused pessimism among investors. The street's expectation of the stock price back then was the three-digit mark.
However, recent trends indicate a positive shift in the stock price trend. This is on the back of a short-covering rally in several IT stocks, including Infosys.
In this editorial, we'll look at the pattern on the weekly chart of Infosys. We will find the key resistance levels and potential for future trends.
Infosys Weekly Chart

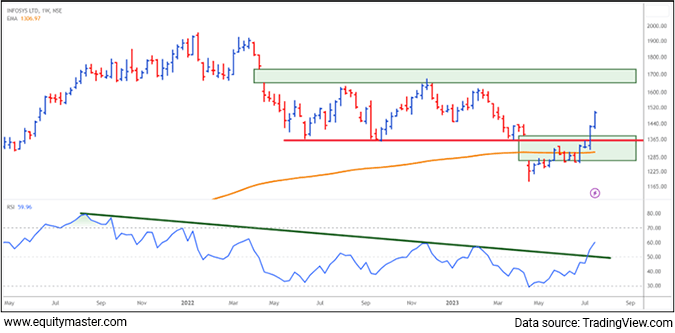
The chart reveals notable developments in the company's stock price.
The 200WEMA and its importance
The stock found support at the 200-week exponential moving average (200WEMA), positioned at Rs 1,300. It successfully overcame the resistance at Rs 1,400.
The 200WEMA is a technical indicator used to analyse the long-term trend of a stock or index. It's calculated by averaging the closing prices of the last 200 weeks, with more weight given to recent data points.
The impact of the 200WEMA is significant because it represents a longer-term moving average. It provides a broader perspective on the stock's trend compared to short-term moving averages.
It helps filter out short-term noise and offers insights into direction of the price trend as well as potential areas of support and resistance.
Currently, the stock is approaching the Rs 1,500 mark, indicating a potential upward trend.
The previous horizontal trendline resistance at Rs 1,350 might now act as a support level. This reversal and breakout align with the principles of the Wyckoff theory, marking a significant shift in sentiment.
Wyckoff theory and the shakeout
I explained Wyckoff theory in a previous article on Nasdaq and Nifty IT - Is the Indian IT Sector a Sleeping Giant? It plays a crucial role in understanding recent developments.
The shakeout observed in Infosys implies the potential formation of a long-term base at Rs 1,185. This suggests the stock has endured a period of selling pressure, followed by a reversal, and a subsequent upward movement.
The next important resistance level for Infosys lies within the Rs 1,650-1,700 range, where an unfilled gap from April 2022 awaits.
The Strength Indicator
The Relative Strength Index (RSI) is a popular technical indicator used to assess the strength and momentum of a stock's price movement.
It measures the magnitude of recent price changes and compares the number of up-moves to down-moves over a specified period.
In the case of Infosys, the trendline breakout on the weekly RSI suggests a shift in momentum and the return of bullish sentiment.
When the RSI breaks above a downward trendline, it signifies that buying pressure is increasing and that the bulls are gaining control.
This breakout can be seen as a positive signal, indicating the stock's strength is improving and potentially leading to further price appreciation.
Market outlook and investor considerations
The performance of Infosys is closely tied to the broader market sentiment, particularly the Nasdaq and Nifty IT index.
If these indices continue to rise, it's likely to attract investors towards the stock price of Infosys.
However, it's important for investors to recognise the risks associated with investing in underperforming stocks, especially when the markets are trading at all-time highs.
Conclusion
Infosys has shown signs of awakening after a period of underperformance and a significant gap-down in April 2023.
The stock price has found support at the 200WEMA level of Rs 1,300 and has successfully surpassed the resistance at Rs 1,400.
An ongoing short-covering rally and the adherence to Wyckoff's theory suggest a potential long-term base forming at Rs 1,185.
Investors should carefully monitor market trends, particularly the performance of Nasdaq and Nifty IT, to gauge the future trajectory of Infosys.
However, caution should be exercised given the risks associated with investing in underperforming stocks amid record-high market levels.
Investment in securities market are subject to market risks. Read all the related documents carefully before investing
Out Now
3 High Conviction Stocks
Chosen by Rahul Shah, Tanushree Banerjee and Richa Agarwal
Report Available
Details of our SEBI Research Analyst registration are mentioned on our website - www.equitymaster.comDisclaimer: This article is for information purposes only. It is not a stock recommendation and should not be treated as such. Learn more about our recommendation services here...

Brijesh Bhatia Research Analyst and expert chartist, is the editor of Alpha Wave Profits. Fully committed to his craft, Brijesh has mastered the art of making money by trading using technical analysis. Brijesh has an MBA from ICFAI and 16 years of experience in India's financial markets. He began his career on Dalal Street as commodities dealer and it wasn't long before he developed his own unique trading system. Brijesh worked on his trading system until it could be expected to deliver 5 units of return for every unit of risk.


Equitymaster requests your view! Post a comment on "Infosys: Rising from the Ashes?". Click here!
Comments are moderated by Equitymaster, in accordance with the Terms of Use, and may not appear
on this article until they have been reviewed and deemed appropriate for posting.
In the meantime, you may want to share this article with your friends!