India's Third Giant Leap
This Could be One of the Biggest Opportunities for Investors
- Home
- Outlook Arena
- Jul 10, 2008 - P/E ratio simplified
P/E ratio simplified
We thought it would be a good time to write this article as the result season is just about to begin. Also, the understanding of this method could help one take a call on which stock to purchase, hold or sell.
Let's start from basics:
P/E ratio: It is one of the basic methods to value a company, on calculating whether it is cheap or expensive at current prices.
P/E ratios are basically of two kinds:
Current P/E multiple - Current market price divided by the trailing twelve months earning per share gives us the current P/E ratio. The higher the P/E the more expensive the stock is, and vice versa. It means that an investor is willing to pay a multiple of a certain times for the company's future earnings.
Also read - P/E - What is it all about?
The main reason a stock may have a high P/E is because the company is expected to be a high growth company (so as such the EPS will grow at a fast rate). In certain cases, stocks having exorbitant P/Es could also mean that the company is going through troubled times and as such may have a low EPS. But since the company is expected to bounce back and record high EPS in the future, its current P/E may look unusually high.
Forward P/E multiple - While current P/E multiple uses the current EPS of the company, the forward P/E multiple, as the name suggests uses the future EPS. The best way of explaining this point would be through an example. If XYZ's stock is trading at Rs 70 and its current EPS (trailing twelve month earnings) is 2, it's trading at a current P/E of 35 times. As mentioned earlier, if a stock is trading at a high P/E rate such as 35, the company is expected to grow at a high pace.
For this example we'll assume a 30% growth in the profits for the next three years. Assuming the profits grow at the rate of 30% each year, for the next three years, its EPS will reach Rs 4.4 per share in FY11. Thus at the current price of Rs 70 rupees the stock will be valued at 15.9 times in FY11 multiple. Thus, we call it a forward P/E multiple of 15.9 times its FY11 earnings.
| XYZ | FY08 | FY09 | FY10 | FY11 |
| P/E | 35.0 | 26.9 | 20.7 | 15.9 |
| Price | 70 | 70 | 70 | 70 |
| EPS | 2.0 | 2.6 | 3.4 | 4.4 |
What is an ideal P/E?
An ideal P/E is a valuation one can give to company's stocks based on certain parameters like their historical valuations, return ratios, future prospects, peer group valuations, industry valuations, future growth potential, management, etc. Ideal P/Es also do vary between companies present in the same sector. For example one would give a higher P/E to a stock like ABB as compared to a stock like Crompton Greaves. The reason mainly would be due to the former's leadership position in its area of business, strong past growth, robust opportunities in the infra space going forward, its parent group support, good return ratios (ROIC, ROCE, RONW), strong and long history of the company and strong balance sheet. We are not saying that Crompton Greaves is a bad company, but in terms of these parameters, ABB scores over it.
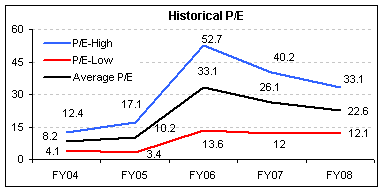
Below is a chart showing an example of a company's past P/E performance. If we look at the P/E multiples of this stock over the past few years, it was trading at a decent (cheap) P/E of around 8.2 times (average) in FY04. Since then the stock has been trading at higher valuations, which could be because of two reasons - the company must have grown at a quick pace (rise in EPS, the denominator hence the price moved accordingly) or investors were ready to pay higher multiples due to high expectations from the company (in the FY06 to FY08 phase).

One can look at this stock's past P/E multiples and give a suitable P/E band to the stock. But one should also keep in mind the other parameters for this concept.
We hope that this article will help you in clearing your thoughts on the fundamentals of the P/E ratio and help you make better investing decisions.


Equitymaster requests your view! Post a comment on "P/E ratio simplified". Click here!
Comments are moderated by Equitymaster, in accordance with the Terms of Use, and may not appear
on this article until they have been reviewed and deemed appropriate for posting.
In the meantime, you may want to share this article with your friends!