
MEMBER'S LOGINX
| Invalid Username / Password | ||||||||
| Invalid Captcha | ||||||||
|
||||||||
| Sign Up | Forgot Password? | ||||||||
- Home
- Views On News
- Apr 21, 2024 - Best Footwear Stock: Bata India vs Relaxo Footwear
Best Footwear Stock: Bata India vs Relaxo Footwear

India is the second largest manufacturer of footwear after China.
The industry is currently valued at US$ 26 billion (bn) (Rs 216 bn) and is expected to grow to US$ 90 bn (Rs 750 bn) by 2030.
Growing disposable incomes, a rising population, a greater focus on health, and a preference for using footwear more as an accessory than a commodity, are driving the growth of the footwear industry in India.
In addition, the share of unorganised players is steadily declining due to a higher preference for branded footwear.
This is a major growth driver for branded footwear players like Bata India and Relaxo Footwear.
In this article, we compare these two companies using various parameters to determine India's best footwear manufacturer.
Business Overview
# Bata India
Part of the Bata Corporation from the Czech Republic, Bata India manufactures and trades footwear and accessories.
It has four manufacturing facilities located in India with a total production capacity of 21 million (m) footwear per annum.
The company sells footwear under some of India's leading brands, such as Bata, Power, Marie Claire, North Star, and Hush Puppies.
# Relaxo Footwear
Relaxo Footwear is the largest footwear manufacturer in India, with a daily production capacity of 0.9 m pairs and a sports shoe capacity of 158,000 spread across eight manufacturing units.
The company manufactures leather and non-leather footwear and offers a wide range of products, including slippers, canvas shoes, and sports shoes.
Almost all the company's brands, such as Flite, Relaxo, Sparx, and Bahamas, are leaders in their respective categories.
| Particulars | Bata India | Relaxo Footwear |
|---|---|---|
| Market Cap (in Rs billion)* | 169.7 | 202.5 |
| Exclusive Brand Outlets (in units) | 2050 | 399 |
Between the two companies, Relaxo Footwear has a higher marketcap of Rs 202.5 bn compared to Bata India, which has a marketcap of Rs 169.7 bn.
However, in terms of exclusive brand outlets, Bata is leading with a network of 2,050 stores, as against Relaxo's 399.
Bata India has a presence pan India and a strong retail network. It also adopted the franchisee model and has over 300 franchised stores in tier 3 and tier 4 cities.
The company also has a strong presence in the non-retail segment through urban wholesale, industrial, institutional, and export divisions.
Bata India is present in over 1,000 towns through multi-brand outlets (MBOs) and also caters to online orders through multiple online channels.
Relaxo Footwear, despite having few exclusive brand outlets, has a robust retail network with over 65,000 retailers and 650 distributors. The company has a strong online presence and exports to over 30 countries.
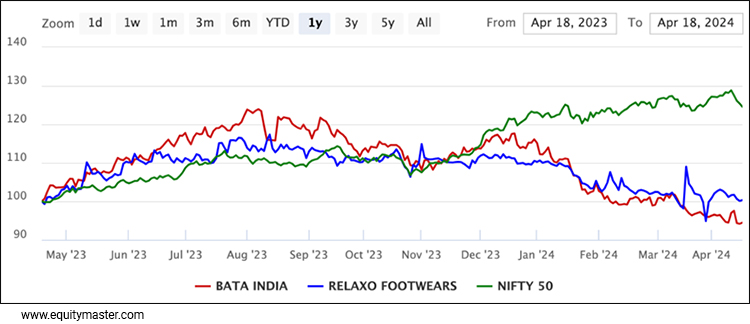
Both these stocks have failed to arouse investor sentiment and have largely underperformed compared to the benchmark Nifty 50.
# Revenue
In terms of revenue, both companies have grown at a similar rate. Relaxo Footwear's net sales have grown at a compound annual growth rate (CAGR) of 4%, whereas Bata India's revenue has grown at a CAGR of 3.3%.
However, Relaxo Footwear has the upper hand as the company's revenue didn't take a hit during the pandemic. Despite the lockdown, the company saw only a marginal decline in revenue.
Bata India's revenue fell sharply mainly because the company supplies to schools and organisations.
If we compare the two companies in terms of volumes, Relaxo Footwear has outpaced Bata India. In financial year 2023, Relaxo Footwear sold 170.8 m pairs, whereas Bata India sold 48.5 m pairs.
However, if we compare revenue, Bata India's revenue is 1.24 times higher compared to Relaxo.
Given that both companies enjoy strong brand recall, growing disposable income, and an increasing population, their revenue is expected to grow in the medium term.
Revenue
| Net Sales (in Rs m) | Mar -2019 | Mar -2020 | Mar -2021 | Mar -2022 | Mar -2023 | 5-Year CAGR |
|---|---|---|---|---|---|---|
| Bata India | 29,311 | 30,561 | 17,085 | 23,877 | 34,516 | 3.3% |
| Relaxo Footwear | 22,921 | 24,105 | 23,592 | 26,533 | 27,828 | 4.0% |
# Profitability
In terms of profitability, Bata India has outpaced Relaxo Footwear.
Bata India's earnings before interest, tax, depreciation, and amortisation (EBITDA) have grown at a CAGR of 10.5% in the last five years, whereas Relaxo's EBITDA has grown at a CAGR of 0.7% during the same period.
Bata India's profit growth was driven by higher sales in the mid and premium categories, which drove the margins upwards despite an increase in raw material prices.
Moreover, the company concentrated on optimising its retail network and cutting costs in rent, operations, and manufacturing.
Relaxo Footwear, on the other hand, succumbed to high volatility in raw material prices and, despite having a high sales volume, could only grow its EBITDA at a very marginal rate.
In terms of net profit, both companies witnessed negative growth, primarily due to high selling and marketing expenses.
In terms of profit margins, Bata India is again leading with a higher gross profit and net profit margin.
Profitability
| EBITDA (in Rs m) | Mar -2019 | Mar -2020 | Mar -2021 | Mar -2022 | Mar -2023 | 5-Year CAGR |
|---|---|---|---|---|---|---|
| Bata India | 4,878 | 8,431 | 1,622 | 4,251 | 8,042 | 10.5% |
| Relaxo Footwear | 3,264 | 4,114 | 4,971 | 4,176 | 3,382 | 0.7% |
| PAT (in Rs m) | Mar -2019 | Mar -2020 | Mar -2021 | Mar -2022 | Mar -2023 | 5-Year CAGR |
| Bata India | 3,290 | 3,290 | -893 | 1,030 | 3,230 | -0.4% |
| Relaxo Footwear | 1,754 | 2,263 | 2,916 | 2,327 | 1,545 | -2.5% |
| Gross Profit Margin | Mar -2019 | Mar -2020 | Mar -2021 | Mar -2022 | Mar -2023 | |
| Bata India | 16.6% | 27.6% | 9.5% | 17.8% | 23.3% | |
| Relaxo Footwear | 14.2% | 17.1% | 21.1% | 15.7% | 12.2% | |
| Net Profit Margin | Mar -2019 | Mar -2020 | Mar -2021 | Mar -2022 | Mar -2023 | |
| Bata India | 11.2% | 10.8% | -5.2% | 4.3% | 9.4% | |
| Relaxo Footwear | 7.7% | 9.4% | 12.4% | 8.8% | 5.6% |
# Debt Management
Both Bata India and Relaxo Footwear have been debt-free companies for more than five years now.
These companies have been generating enough cash flow to meet their capex requirements through internal accruals.
Coming to capex investment, Bata India has been heavily investing in research and development (R&D) to launch new products. Recently, it launched products with antimicrobial properties and "ortho-lite" for "Power" shoes to increase comfort and the fitting experience.
With respect to retail expansion, the company is following the asset-light model and is focussing on opening franchise stores more than company-owned stores.
Relaxo Footwear, on the other hand, is increasing its R&D investments to develop new products for its customers. The result of the R&D can be seen in the number of intellectual property rights (IPRs) the company has on its name.
At the end of March 2023, the company had 87 registered trademarks, ten copyrights, and 1,024 product designs.
# Financial Efficiency
Return ratios help assess how efficiently a company runs its business.
The two return ratios that are widely used are return on capital employed (RoCE) and return on equity (RoE).
The RoCE of Bata India and Relaxo Footwear averaged 22.3% and 21.4%, respectively, in the last five years.
Bata India's RoCE has been growing consistently, whereas Relaxo Footwear's RoCE has dropped by half in the last five years.
Even in terms of RoE, Bata India is leading. In the financial year 2023, the RoE of Bata India and Relaxo Footwear were 22.5% and 8.3%, respectively.
Bata India's cost-cutting initiatives and high sales from the premium segments drove the company's return ratios upward.
Financial Efficiency
| ROCE | Mar -2019 | Mar -2020 | Mar -2021 | Mar -2022 | Mar -2023 |
|---|---|---|---|---|---|
| Bata India | 28.2% | 32.5% | -0.5% | 13.2% | 38.1% |
| Relaxo Footwear | 25.2% | 24.6% | 26.2% | 18.6% | 12.5% |
| ROE | Mar -2019 | Mar -2020 | Mar -2021 | Mar -2022 | Mar -2023 |
| Bata India | 18.9% | 17.4% | -5.1% | 5.7% | 22.5% |
| Relaxo Footwear | 16.0% | 17.9% | 18.6% | 13.2% | 8.3% |
# Dividend
A company distributes its profits in terms of dividends to its shareholders.
A high and consistently growing dividend is considered a good sign as it indicates that the company's profits are stable.
In the last five years, Bata India's dividend has grown at a CAGR of 16.7%, whereas Relaxo Footwear's dividend has grown at a CAGR of 22.7%.
The five-year average dividend yield of Bata India is around 1%, whereas for Relaxo Footwear, it is 0.2%.
In terms of dividend payout ratio, Bata India is again leading with 53.7% against 40.3% for Relaxo Footwear.
Dividend
| Dividend Per Share (Rs) | Mar -2019 | Mar -2020 | Mar -2021 | Mar -2022 | Mar -2023 | 5-Year CAGR |
|---|---|---|---|---|---|---|
| Bata India | 6.3 | 4.0 | 4.0 | 54.5 | 13.5 | 16.7% |
| Relaxo Footwear | 0.9 | 1.3 | 2.5 | 2.5 | 2.5 | 22.7% |
| Dividend Yield | Mar -2019 | Mar -2020 | Mar -2021 | Mar -2022 | Mar -2023 | |
| Bata India | 0.6% | 0.3% | 0.3% | 3.1% | 0.8% | |
| Relaxo Footwear | 0.2% | 0.2% | 0.3% | 0.2% | 0.2% | |
| Dividend Payout Ratio | Mar -2019 | Mar -2020 | Mar -2021 | Mar -2022 | Mar -2023 | |
| Bata India | 24.4% | 15.6% | -57.6% | 680.1% | 53.7% | |
| Relaxo Footwear | 12.7% | 13.7% | 21.3% | 26.7% | 40.3% |
# Valuations
To know the actual worth or intrinsic value of a company, we must look at its valuation ratios.
The two most widely used valuation ratios are price to earnings (P/E) and price to book value (P/B). These ratios tell us whether a company is overvalued or undervalued.
In terms of P/E, Relaxo Footwear is highly overvalued compared to Bata India. The company's P/E ratio is 100.2x, compared to Bata's 64.2x.
In terms of the P/B ratio, Bata India's shares are overvalued compared to Relaxo Footwear. The company's P/B ratio is 11.8x, compared to 10.5x for Relaxo Footwear.
However, if we compare both companies' five-year averages and industry averages, both are highly overvalued.
Valuations
| Valuations | Bata India | 5-Year Average | Relaxo Footwear | 5-Year Average |
|---|---|---|---|---|
| P/E (x) | 64.2 | 36.4 | 100.2 | 95.8 |
| P/B (x) | 11.8 | 11.2 | 10.5 | 12.8 |
Which Footwear Stock is Better: Bata India or Relaxo Footwear?
In terms of revenue growth, Relaxo Footwear outpaced Bata India by a small margin.
However, Bata India is leading in terms of profit growth, profit margins, return ratios, and dividends.
Bata India is one of the oldest players in the footwear industry and has a healthy market share.
It also enjoys a strong brand recall and is known for its quality. However, the company couldn't sell itself as a premium brand.
Hence, it has undertaken several initiatives to include more premium brands in its portfolio over the years.
The company also launched various marketing initiatives to market itself as a premium brand.
To expand its retail network, it follows an asset-light model and gives out franchisees, ensuring steady revenue at low investment.
It also focuses on its non-retail segment to reduce the concentration risk in its revenue profile.
It is also undertaking cost-cutting initiatives in rentals and manufacturing to improve its profitability.
Overall, Bata India is paving its way to grow steadily in the future.
Relaxo Footwear, on the other hand, is focusing on developing new products to strengthen its product portfolio. This has also helped the company improve its export revenue.
Having one of the largest distribution networks in the footwear industry, it is capitalising on this to drive its revenue by introducing new products.
Both Relaxo Footwear and Bata India are well established to capture the growth of the rising population and increasing disposable incomes.
However, Bata India has the upper hand in generating higher profits from its revenue.
Disclaimer: This article is for information purposes only. It is not a stock recommendation and should not be treated as such. Learn more about our recommendation services here.
ABOUT EQUITYMASTER
Since 1996, Equitymaster has been the source for honest and credible opinions on investing in India. With solid research and in-depth analysis Equitymaster is dedicated towards making its readers- smarter, more confident and richer every day. Here's why hundreds of thousands of readers spread across more than 70 countries Trust Equitymaster.
PREMIUM PRODUCTS
QUICK LINKS
POPULAR TOPICS
- Multibagger Penny Stocks
- Basics of Value Investing
- Benjamin Graham
- How to Invest in Gold
- How to Invest in Silver
- Best Stocks to Buy Today
- Best Small-cap Stocks to Buy
- Best Bluechip Stocks to Buy
- Guide to Penny Stocks
- How to Invest in the Share Market
- Warren Buffett - The Value Investor
- Pick the Best Multibagger Stocks
TRENDING TOPICS
 Donate to credible NGOs in the sector of your choice (ii) Claim 50% tax benefit u/s 80G (iii) Receive periodic reports.")
Copyright © Equitymaster Agora Research Private Limited.
Whitelist | Refer | Terms | Privacy | Contact | About | Sitemap
Equitymaster Agora Research Private Limited (Research Analyst)
SEBI (Research Analysts) Regulations 2014, Registration No. INH000000537.
103, Regent Chambers, Above Status Restaurant, Nariman Point, Mumbai - 400 021. India.
Telephone: +91-22-61434055. Email: info@equitymaster.com. Website: www.equitymaster.com.
CIN:U74999MH2007PTC175407
Name of the Compliance & Grievance Officer: Ms Sonal Ramachandran
Telephone: +91-22-61434003 | Email: compliance@equitymaster.com
LEGAL DISCLAIMER:
Investment in securities market are subject to market risks. Read all the related documents carefully before investing.
Registration granted by SEBI and certification from NISM in no way guarantee performance of the intermediary or provide any assurance of returns to investors.
All rights reserved. Any act of copying, reproducing or distributing this newsletter whether wholly or in part, for any purpose without the permission of Equitymaster is strictly prohibited and shall be deemed to be copyright infringement.
Equitymaster Agora Research Private Limited (Research Analyst) bearing Registration No. INH000000537 (hereinafter referred as 'Equitymaster') is an independent equity research Company. Equitymaster is not an Investment Adviser. Information herein should be regarded as a resource only and should be used at one's own risk. This is not an offer to sell or solicitation to buy any securities and Equitymaster will not be liable for any losses incurred or investment(s) made or decisions taken/or not taken based on the information provided herein. Information contained herein does not constitute investment advice or a personal recommendation or take into account the particular investment objectives, financial situations, or needs of individual subscribers. Before acting on any recommendation, subscribers should consider whether it is suitable for their particular circumstances and, if necessary, seek an independent professional advice. This is not directed for access or use by anyone in a country, especially, USA, Canada or the European Union countries, where such use or access is unlawful or which may subject Equitymaster or its affiliates to any registration or licensing requirement. All content and information is provided on an 'As Is' basis by Equitymaster. Information herein is believed to be reliable but Equitymaster does not warrant its completeness or accuracy and expressly disclaims all warranties and conditions of any kind, whether express or implied. Equitymaster may hold shares in the company/ies discussed herein. As a condition to accessing Equitymaster content and website, you agree to our Terms and Conditions of Use, available here. The performance data quoted represents past performance and does not guarantee future results.
Equitymaster requests your view! Post a comment on "Best Footwear Stock: Bata India vs Relaxo Footwear". Click here!
Comments are moderated by Equitymaster, in accordance with the Terms of Use, and may not appear
on this article until they have been reviewed and deemed appropriate for posting.
In the meantime, you may want to share this article with your friends!